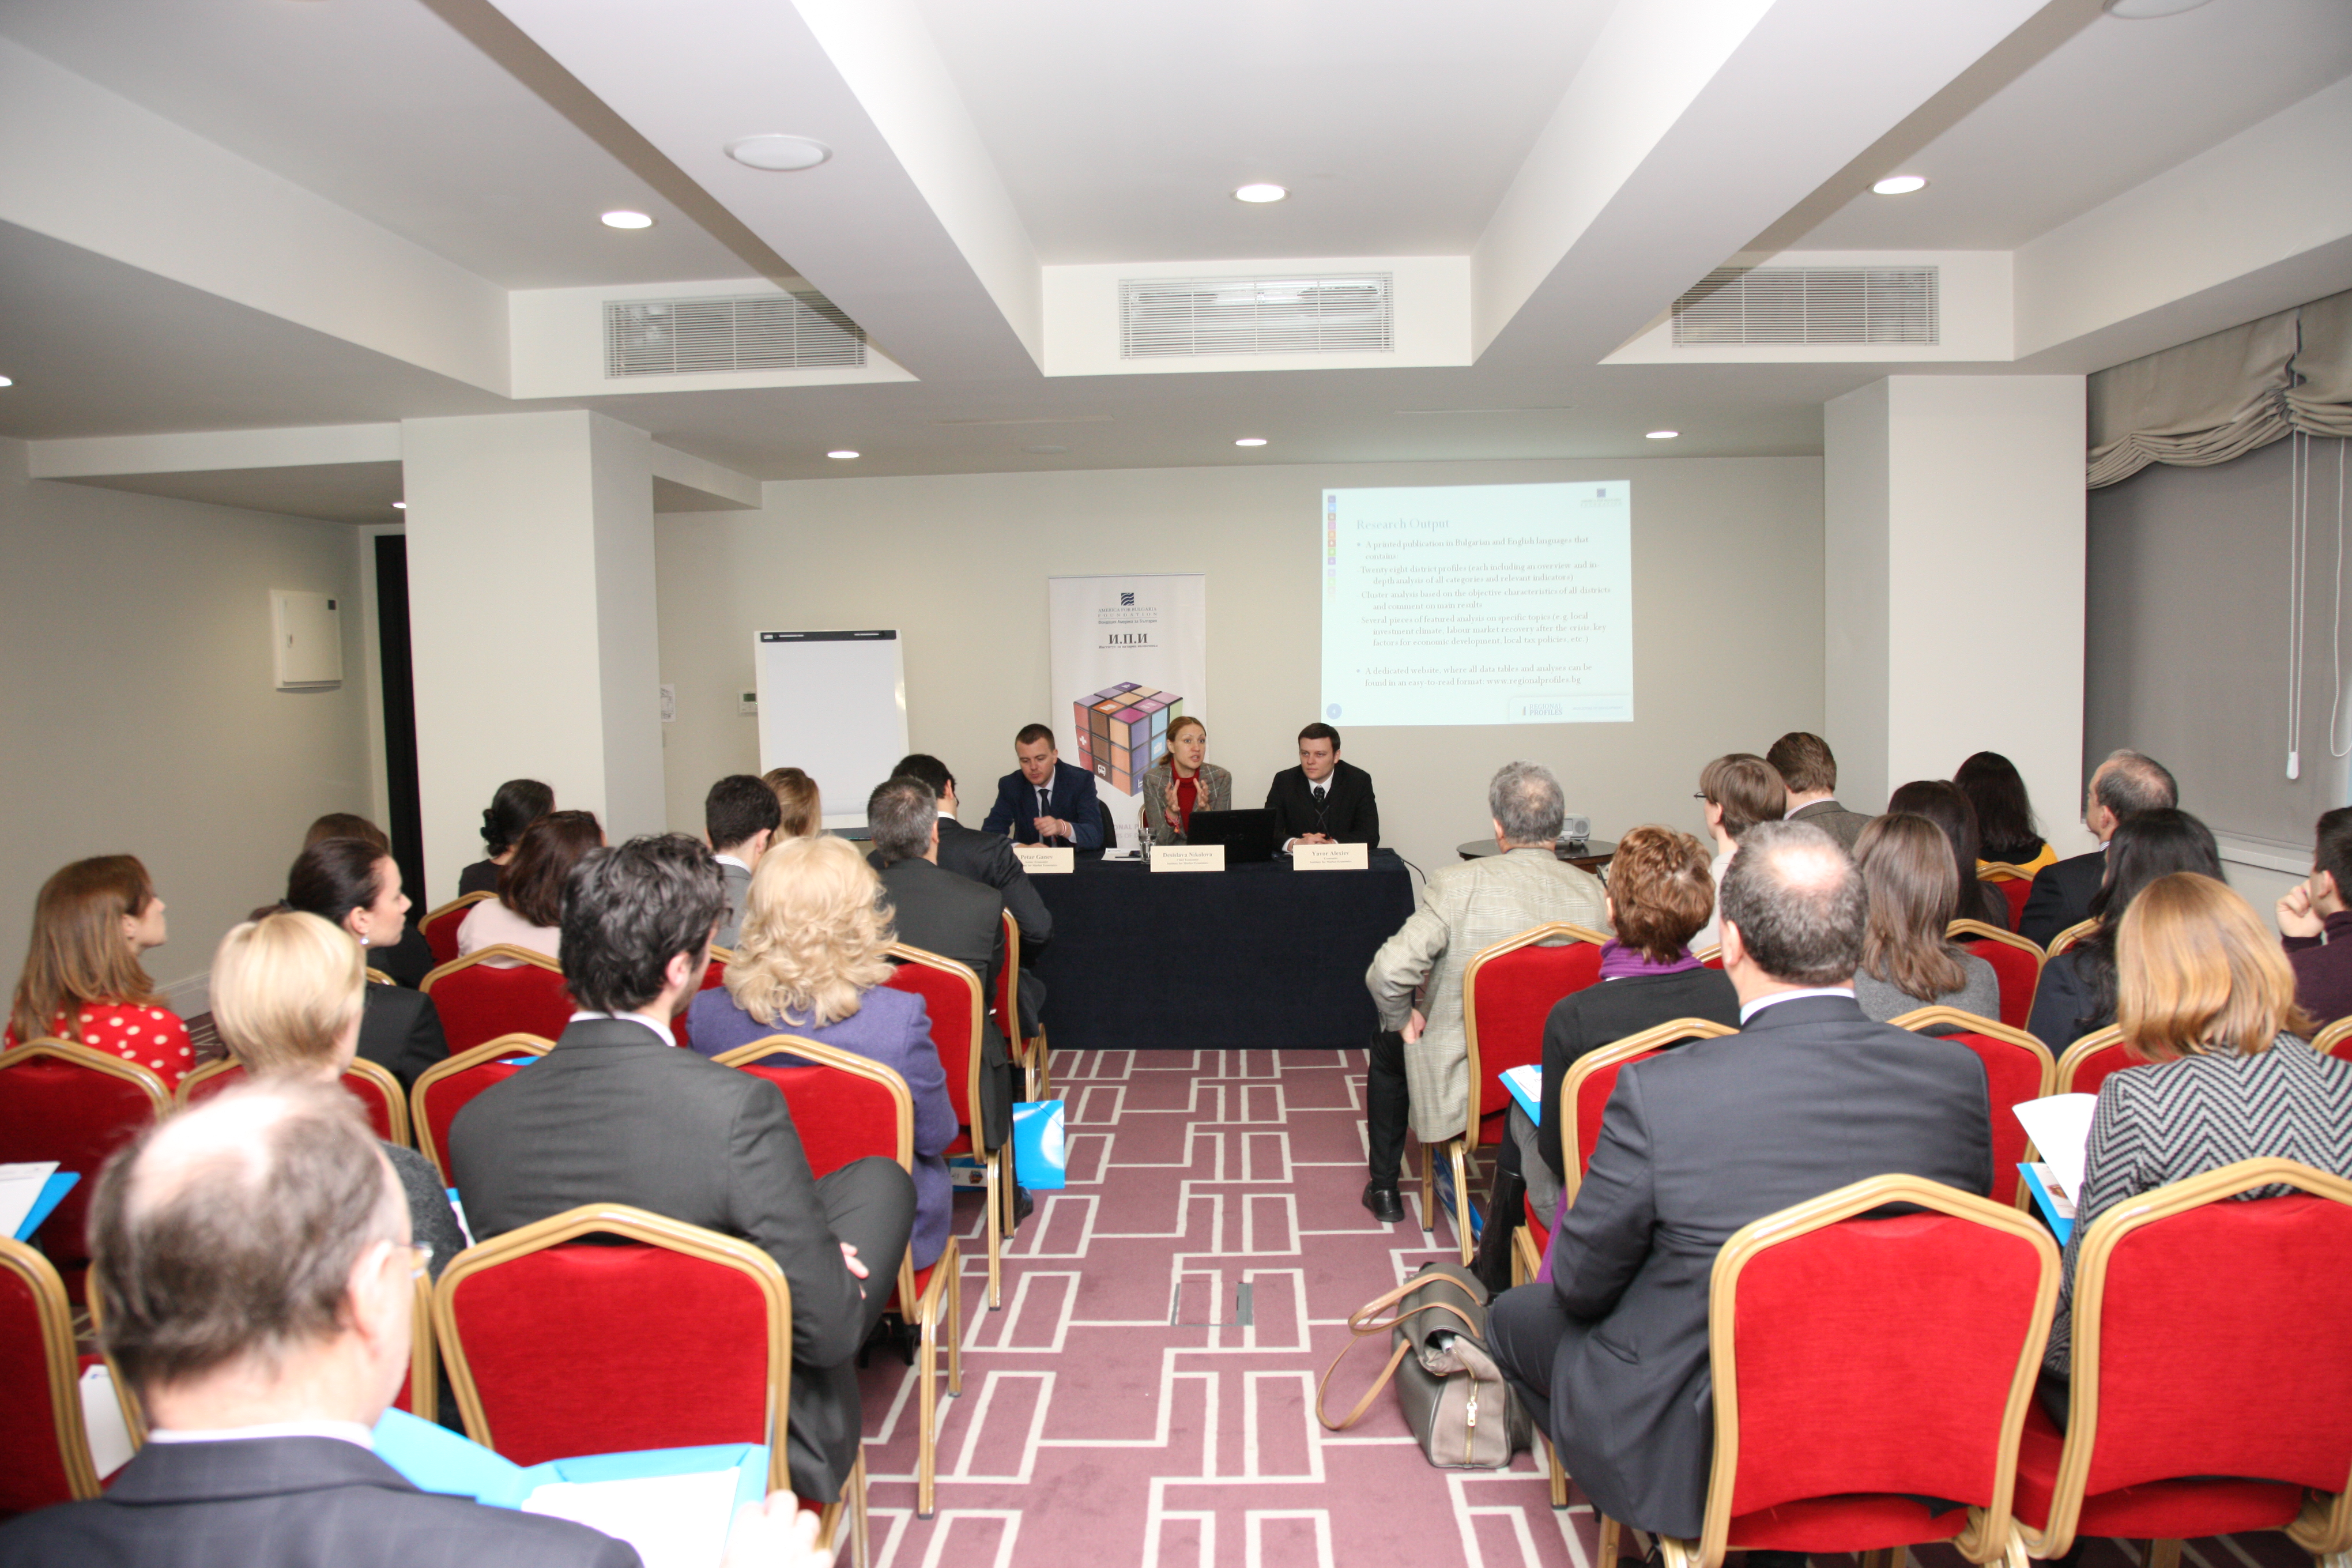
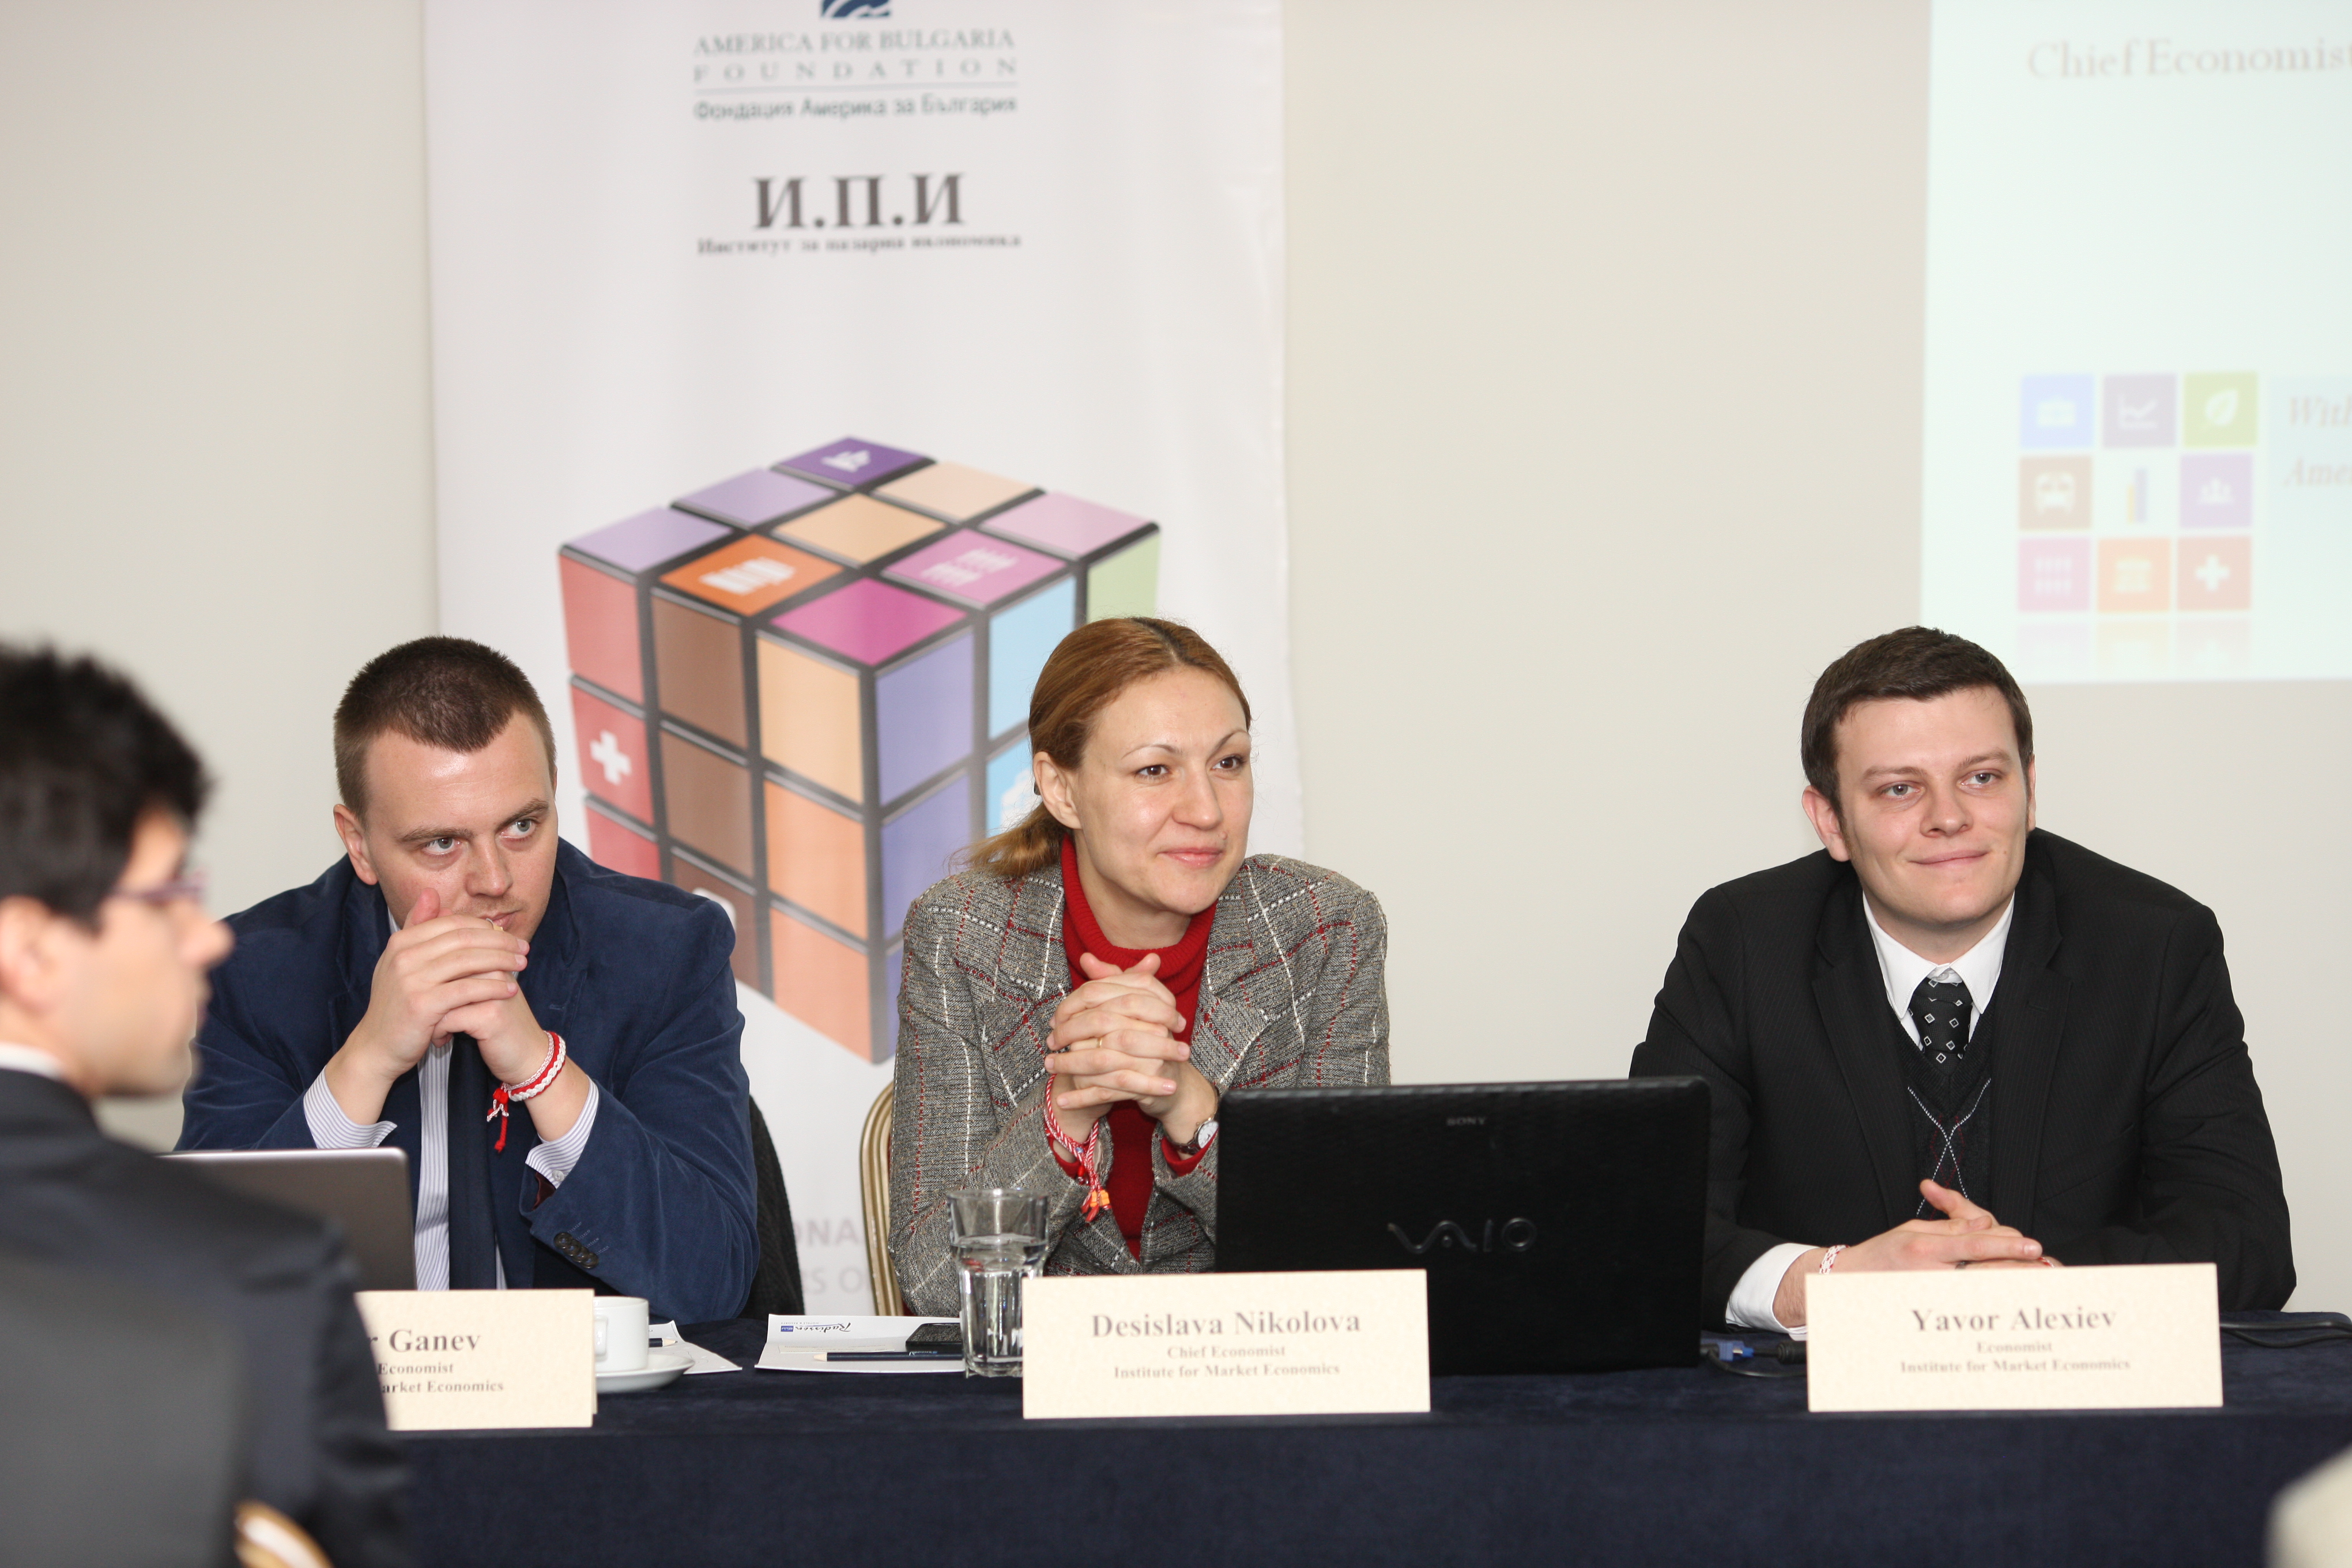
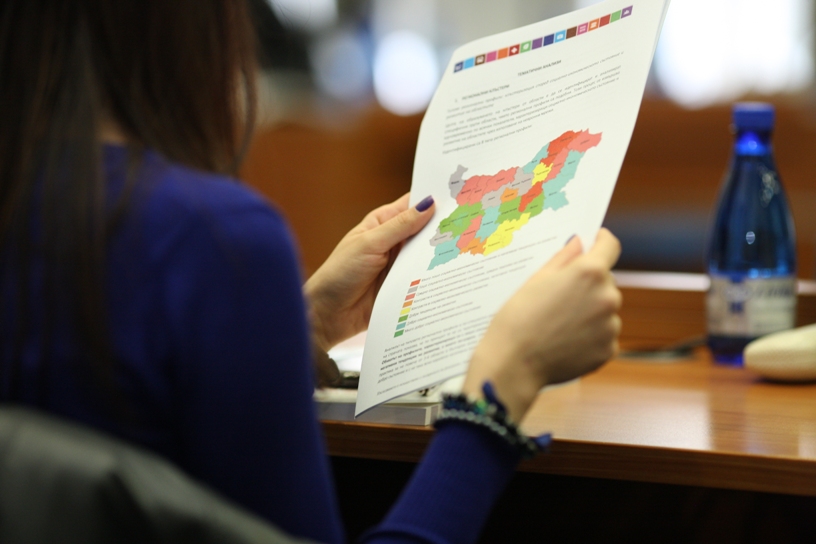
IME presented the English edition of Regional Profiles 2013
The event was attended by representatives of leading foreign embassies and chambers of commerce and industry.
The event was attended by representatives of leading foreign embassies and chambers of commerce and industry.
The goal of the multidimensional analysis of regional development using neural networks – Cohonen Self-Organizing Maps (SOM) is to review and analyze the overall socio-economic development of Bulgarian districts in the 2008-2011 period.
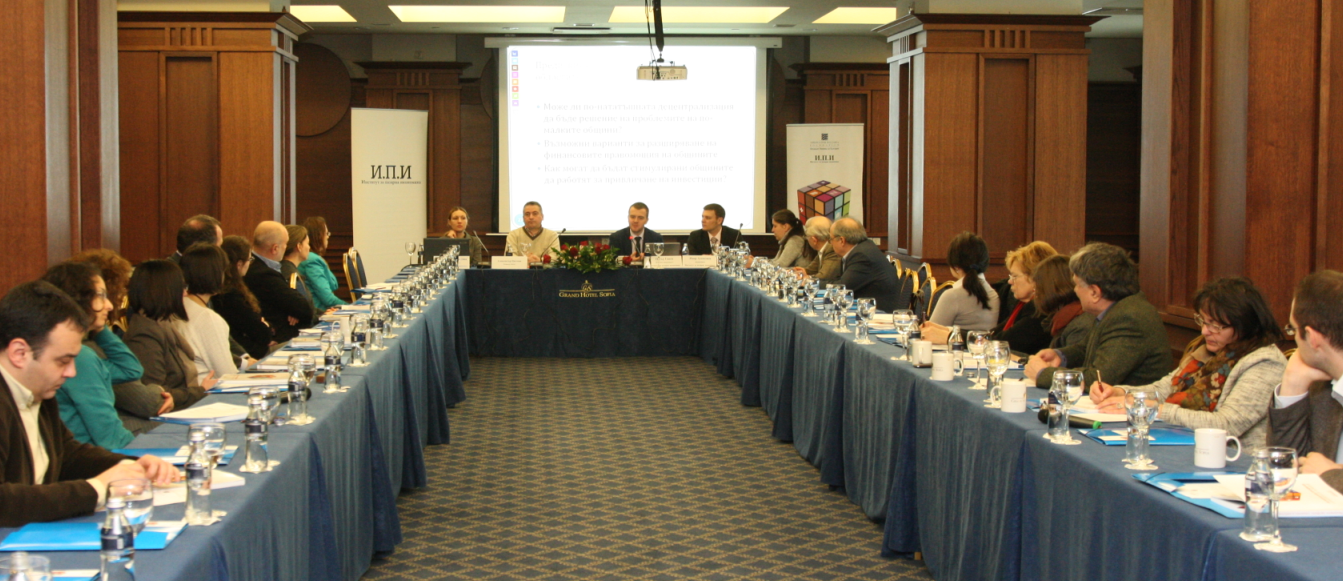
On February 6th 2014 the Institute for Market Economics organized a round table discussion, as part of the project “Regional Profiles: Indicators of Development”, carried out with the financial support of the America for Bulgaria Foundation. The discussion was attended by experts from public administration and NGOs, academics and professionals in the fields of regional development and statistics.
On December 11th, 2013 the IME economists Desislava Nikolova and Petar Ganev visited Kyustendil in response to an invitation of the district’s governor Ivan Karakashki.
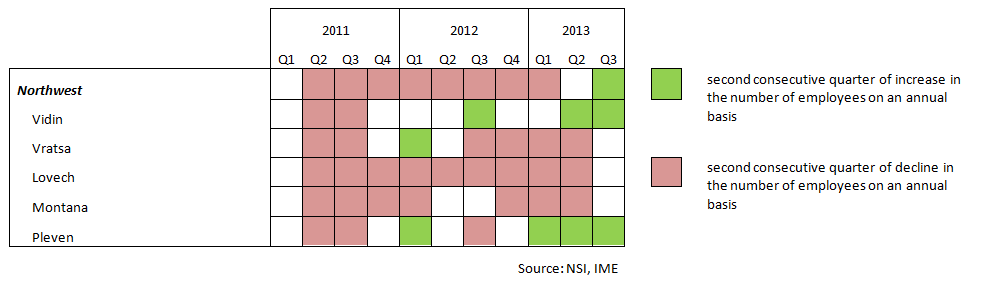
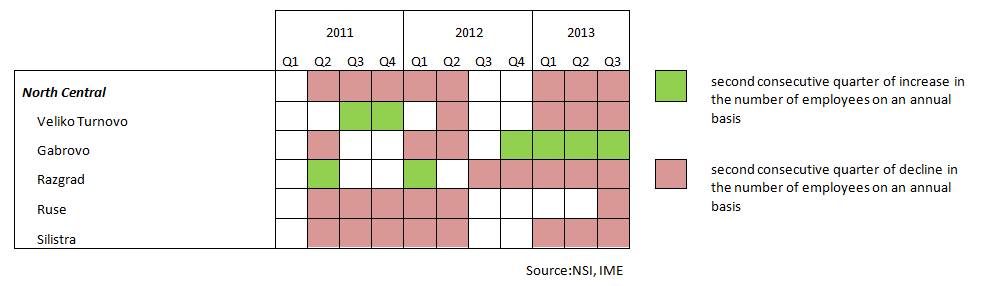
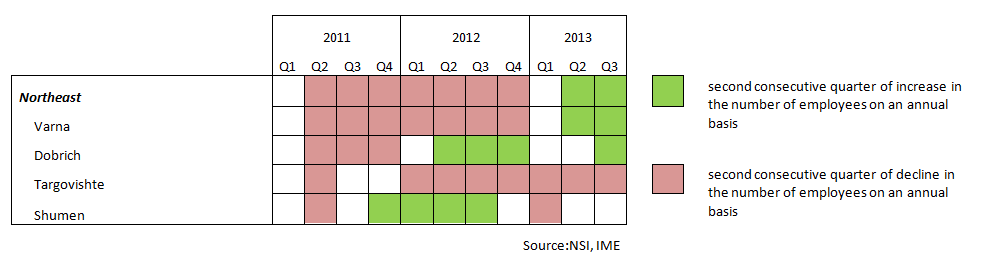
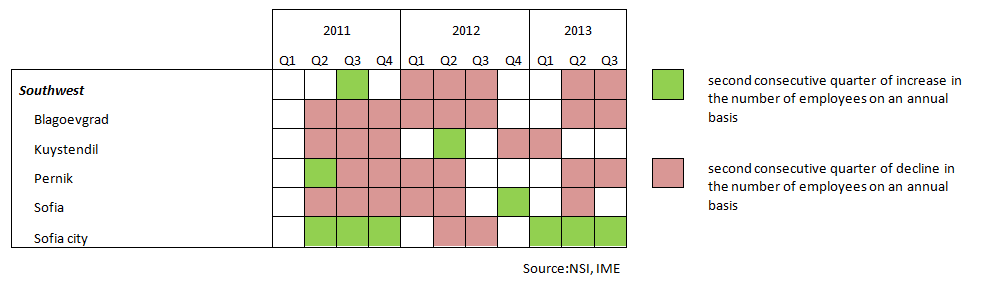
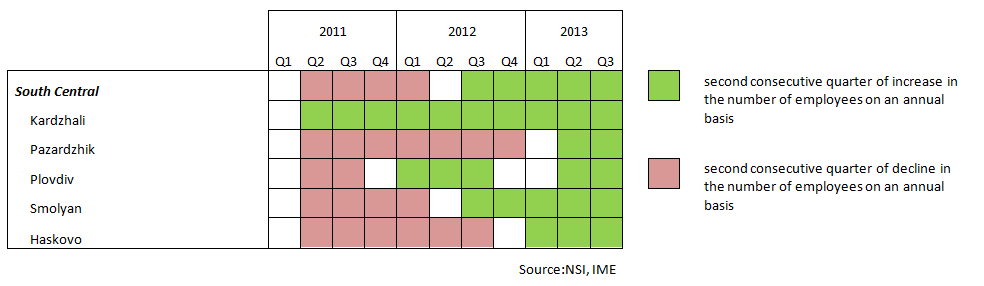
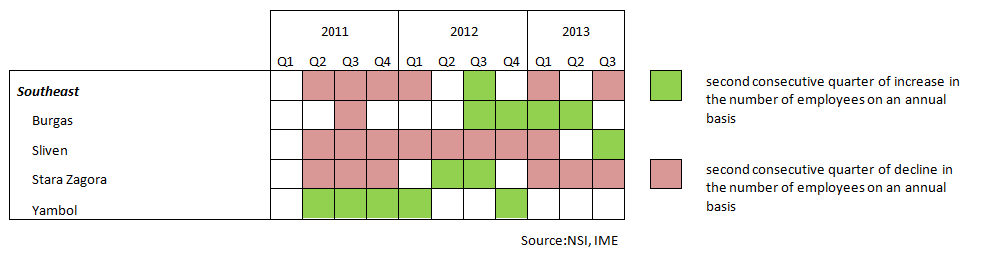
After two consecutive quarters of growth on annual basis, the number of people employed once again decreased in the third quarter of 2013.
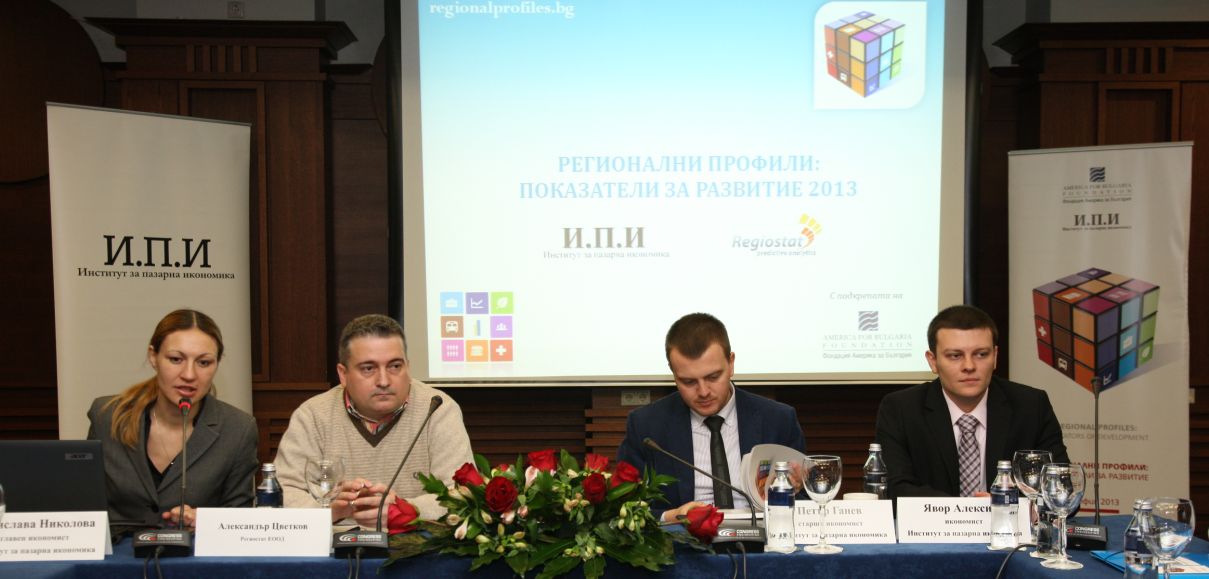
 The study was presented on November 14th 2013.
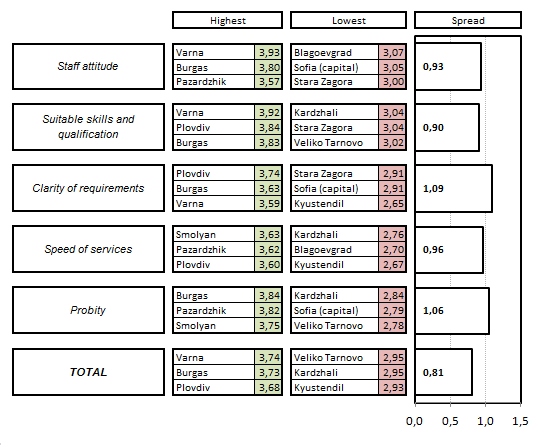
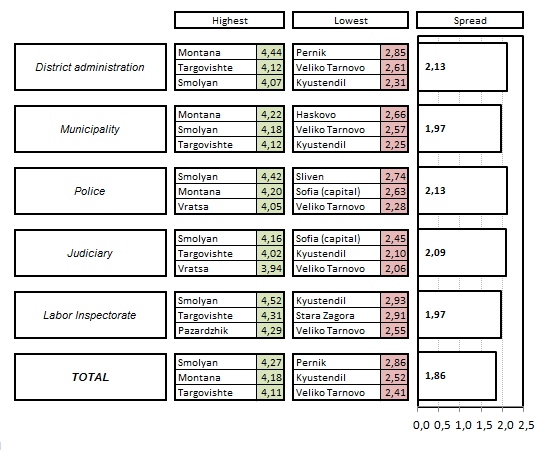
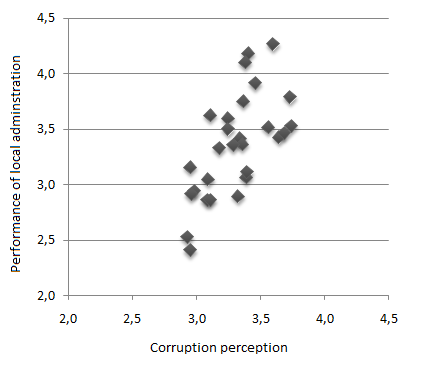
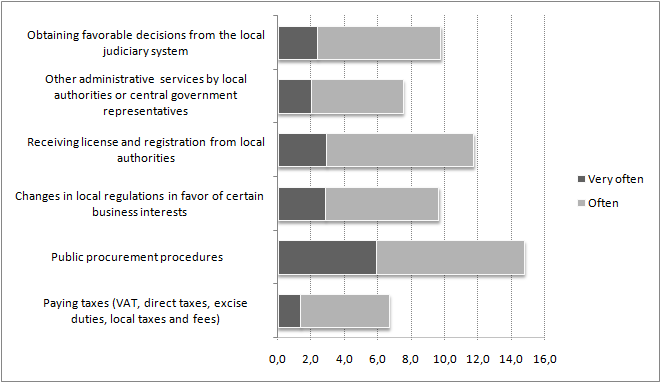
There is a connection between the assessment of businesses about the quality of administrative services and corruption perceptions
The province is not a problem of the capital — it is a problem of politics 03.04.2026
In 2025, 159 Bulgarian municipalities (60% of all) implemented exactly 400 projects included in the...
All municipal projects can start this year – here's how 04.03.2026
Is it possible for all municipal projects in the state budget – worth a total of over 4 billion euros –...
Regional inequalities are growing 02.03.2026
Deep regional inequality remains one of the most persistent challenges to Bulgaria's economic development....
Sofia for another year breaks away from other regions in economic development 16.02.2026
In 2024, Sofia continues to stand out more and more clearly in its economic development from the other...