Demographics
Information
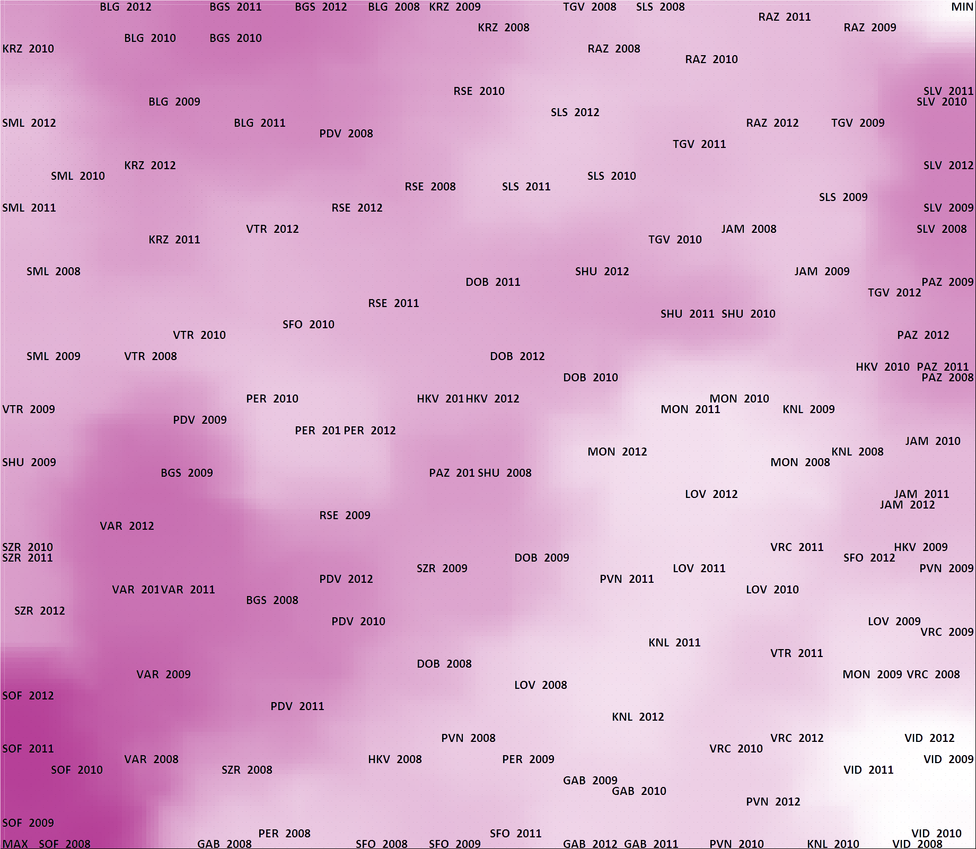
This map shows the demographic condition and development of districts.
Sofia (cap) has the highest level of demographic development, as well as the most favorable tendencies, followed by the districts of Varna, Plovdiv, Blagoevgrad and Burgas.
The districts of Sliven and Pazardzhik are also in relatively good demographic condition, but this is largely due to the specific ethnic structure of the local population. Their placement close to the upper-right corner of the map shows that this has not affected their overall socio-economic condition positively.
The districts of Vidin, Lovech and Montana are in worst demographic condition during the entire period.
The districts of Smolyan and Gabrovo show negative development trends during the entire period.
Methodology
The multidimensional analysis of regional development analyzes the overall socio-economic development of Bulgarian districts in the 2008-2012 period, using a wide variety of indicators, grouped in seven categories: economy, infrastructure, demographics, education, healthcare, environment, social environment. The method chosen to achieve this is neural networks – Cohonen Self-Organizing Maps (SOM), to be precise.
Two “fake regions” have been established for the purpose of this analysis. One is a “perfect” region, which scores best (has the highest marks) on all indicators at the same time. The other one is a “worst” region, which scores worst (has the lowest marks). These “fake regions” are used as reference points and benchmarks for assessing the development of the 28 regions during this period. The current state and development of all 28 regions is assessed as positive or negative in comparison to these benchmarks.
One should note that on the maps of the different categories the best-developed territory does not necessarily coincide with the “perfect region”, neither the worst-developed territory coincides with the “worst region”. This happens because the “best” and the “worst” region are defined as such on the basis of all categories at the same time and are therefore fake and do not really exist. Empirical data shows that some regions score high in some categories and low in others.
After the analysis, the districts have been grouped into clusters, formed by Cohonen’s self-organizing maps. The results are represented by two separate methods:
- The clusters are presented through the so-called “unified distance matrix” (U-matrix). The dark zones represent the borders of the clusters, the light ones – the clusters themselves. The darker the border between the clusters, the more they differ from each other and vice versa.
- Each zone on the Cohonen map is characterized by a certain level of development, achieved during the period (low or high) based on the different categories – from economy to social environment. The rankings in the different categories are also represented visually on the different maps, with the more saturated color representing high ranking, while a less saturated – low ranking.
If a region ranks “best” in each of the categories – from economy to social environment, it should match the “perfect” one or be very close to it. In reality, none such exists, so the regions are located all over the map. The reasons for their location can be seen in the analysis of the different categories.
The results thus represented in the Cohonen maps allow us to study the development of all regions for the entire period at the same time, visualizing:
- Difference levels – how much do certain regions differ from the others during one or all years of the period;
- Development directions – whether the development of the regions shows a positive or a negative trend;
- Speed of development – what is the pace of growth or decline;
- Development trajectoryis the re cohesion between the regions, or – even better – an approach towards the “perfect region”.