Is Employment Really Rising?
Yavor Alexiev
The results of the Labour Force Survey for 2012 and the revised labour market statistics for 2011, published about a month ago, reveal some interesting trends on district level.
To start with, the employment rate of the population aged 15+ has been revised downwards in only three districts-Pazardzhik, Blagoevgrad and Smolyan (Table 1). In Varna and Sofia (city) the rate of employment has remained unchanged, while in all other districts the rate of employment has increased. The average increase of employment for the country as a whole is by 1 percentage point – from 45,6 to 46,6%.
Table 1: Effect of revision on the employment rate for the population aged 15+ by districts, difference in percentage points as compared to preliminary data for 2011
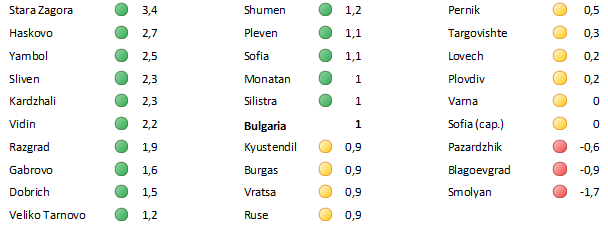
Source: NSI
What stands behind the increase of employment?
The increase of the employment rate is a result of the modified procedure [1] for estimating the weights, applied since the beginning of 2012. It is also a consequence of the correction in the estimates of the population that followed the 2011 Census. The Census information has helped establish the actual demographic status [2] of the districts, which has led to a more accurate assessment of the economic activities of population. Graph 1 depicts a part of the effect arising from the census of the average annual population by districts on revising the employment data.[3]
Graph 1: Revision of employment data in 2011, and difference between regular estimates of the annual average population and Census 2011 results.
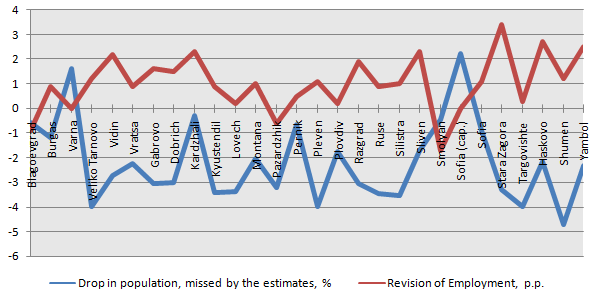
Source: NSI, IME calculations
The Graph shows the underestimated employment rate for the period 2002-2011 in most districts due to higher estimates of the population by the National Statistics Institute. The bad news is that this is the statistical effect of a population and hence – labour force shrinking much faster than the rate of job creation. The population has diminished much quicker than projected in 26 out of the 28 districts. The only exceptions are Varna and Sofia where it increases faster than expected.
What happened in 2012?
According to the last published data of NSI for 2012, employment increased in 16 districts and declined in 11. The only region where change is not observed is Stara Zagora.
Table 2: Year-on-year changes in the employment rate in 2012, difference in percentage points as compared to revised data for 2011.

Source: NSI
Despite this positive tendency in employment rates, the number of jobs increased in only 9 districts. In 2012 the number of those employed in the district of Burgas increased by 3.9 thousand, in Plovdiv – by 3.5 thousand, in Dobrich – by 3.3 thousand and in Kyrdzhali and Smolyan - by around 3 thousand. The trend in Varna is alarming because the employment rate there decreased by 2,3 percentage points, while the number of employed people – by 10 thousand. In other words, about one third of the jobs lost in 2012 are in the in district of Varna, and roughly the same number of job losses occurred in the districts of Sofia and Pazardzhik.
Graph 2: Employment rate dynamics and number of employed 2012-2011
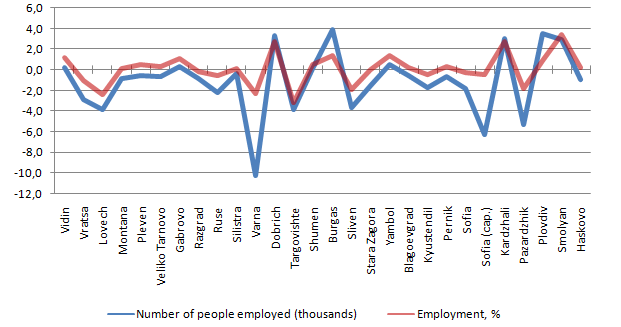
Source: NSI
Data on the developments of the labour market on regional level for the last two years do not provide reasons for joy in 2013. At this moment the increase in employment is not the result of jobs’ recovery, but of the quick decline of the population, including the economically active people. The 2011 Census data shows a higher employment than earlier estimated precisely because the number of people of working age decreases faster than expected. The actual job recovery is yet to come.
The project “Regional Profiles: Indicators of Development” is carried out with the financial support of the America for Bulgaria Foundation.
[1] See the methodology of the study “Labour Force Survey”, pages 5-6 (http://www.nsi.bg/img/MRUBRIK/LFS_Methodology.pdf)
[2] The projection for the demographic development of the population in each district is important in determining the employment rate, because its value affects the weights in the sample, on the basis of which the economic activity of the population is estimated.
[3] The red line in Graph 1 depicts the difference between preliminary data on employment rates for the population aged 15+ for 2011 and the revised information based on the Census. The blue line represents the registered deviation from the increase or decrease of the population aged 15+ in each district, arising from the annual demographic estimates of NSI. The data is derived when from the dynamics of the average annual population for the period 2002-2010 we subtract the difference between the annual average value for the period 2002-2010 and the data for 2011 alone. The latter have a corrective function because they are based on the Census 2011. For instance, the average annual population of Plovdiv for the 2002-2010 period dropped by 1845 people on average per year. In 2011 alone, as a result of the census, an annual decline by 16 865 people is observed. The difference between the 2011 values and the average value for 2002-2011 period is 15 020 people. After that, the number of people aged 15+ (within those 15,020) is estimated based on the share of the population aged 15+ in the starting year 2001. Their percentage in the entire population aged 15+ for 2001 is actually the change of the average annual population aged 15+ for the entire period 2002-2011 that has missed by the regular annual demographic estimates of NSI.
Of course, the values thus derived are conditional due to the constant changes of the age characteristics of district population. But in view of the tendencies for increase of the average age in all districts, the share of people is unlikely to be lower than the values obtained using this method.

