The IME will visit Blagoevgrad, Plovdiv, Stara Zagora, Varna, Gabrovo and Vratsa
A team of IME economists will visit and organize a series of roundtables in Blagoevgrad, Plovdiv, Stara Zagora, Varna, Gabrovo and Vratsa.
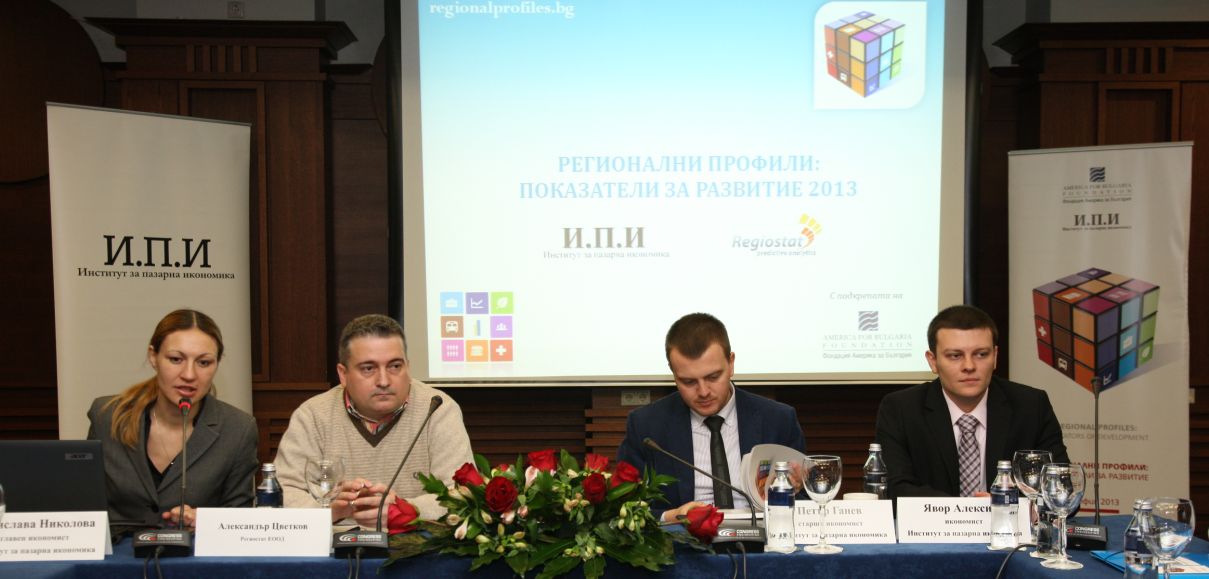
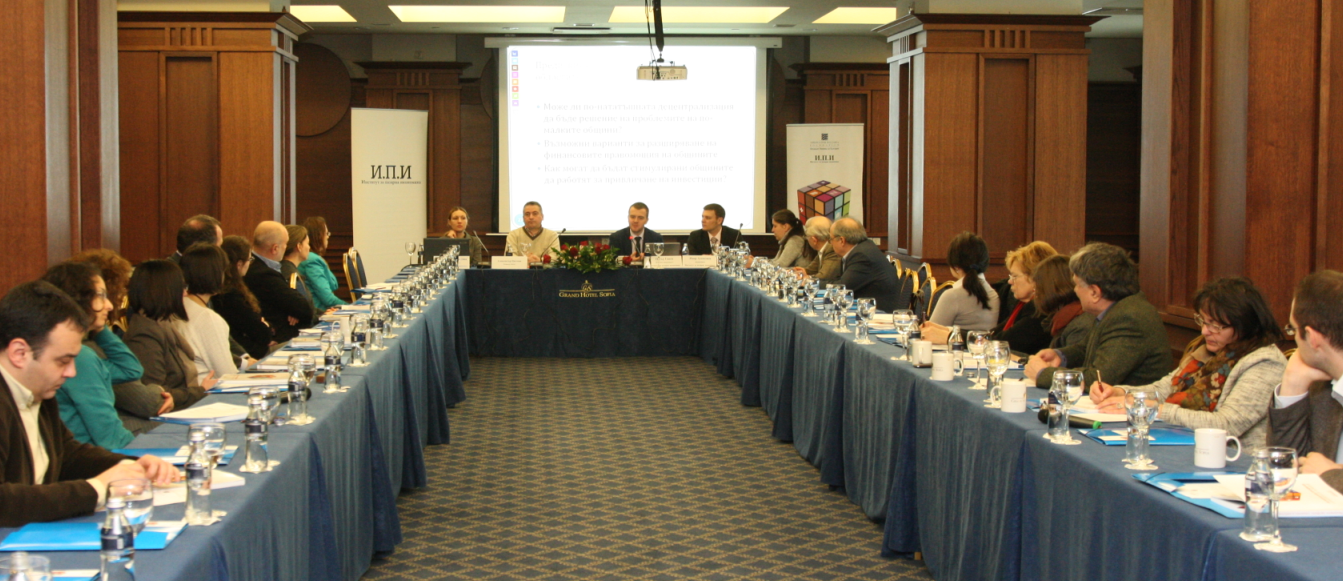
Between 9th and 19th June 2014 a team of IME economists will visit and organize a series of roundtables in Blagoevgrad, Plovdiv, Stara Zagora, Varna, Gabrovo and Vratsa. The tour is part of the preparation of the third edition of the study "Regional Profiles: Indicators of Development", carried out with the financial support of the "America for Bulgaria" Foundation.
The roundtables are organized with the support of the central and local structures of the Bulgarian Chamber of Commerce and Industry.
Monday, June 9th, 2014 Blagoevgrad
- Presentation of the study "Regional Profiles: Indicators of Development" with a focus on the development of Blagoevgrad and the Southwest region , followed by a discussion
- Location : American University in Bulgaria , Red Hall
- Start: 9:45
Wednesday, June 11, 2014 Plovdiv
- Presentation of the study "Regional Profiles: Indicators of Development" with a focus on the development of Plovdiv and the South Central region, followed by a discussion
- Presentation of the investment profile of Plovdiv and the region (Industry Watch)
- Location: Novotel Plovdiv hall " Moscow"
- Start: 9:45
Thursday, June 12, 2014 Stara Zagora
- Presentation of the study "Regional Profiles: Indicators of Development" with a focus on the development of Stara Zagora and the Southeast region, followed by a discussion
- Location: Chamber of Commerce and Industry Stara Zagora, Georgi Rakovski 66
- Start: 9:45
Monday, June 16, 2014 Varna
- Presentation of the study "Regional Profiles: Indicators of Development" with a focus on the development of Varna and the Northeastern region, followed by a discussion
- Location: Varna Radio Concert Studio
- Start: 9:45
Wednesday, June 18, 2014 Gabrovo
- Presentation of the study "Regional Profiles: Indicators of Development" with a focus on the development of Gabrovo and the North Central region, followed by a discussion
- Location : Technical University - Gabrovo , Library Hall
- Start: 9:45
Thursday, June 19, 2014 Vratsa
- Presentation of the study "Regional Profiles: Indicators of Development" with a focus on the development of Vratsa and the North Central region, followed by a discussion
- Location: Chamber of Commerce and Industry Vratsa
- Start: 9:45
The events will be held in Bulgarian.
Join us! For more information and registration:
Vessela Dobrinova | vessela@ime.bg | (+359 2) 952 62 66