Migration to Sofia is Comparable to External Migration
Amid frequently cited data on external migration, migration processes taking place inside the country, often stay away from the public interest.
Yavor Aleksiev, Bozhidar Radev*
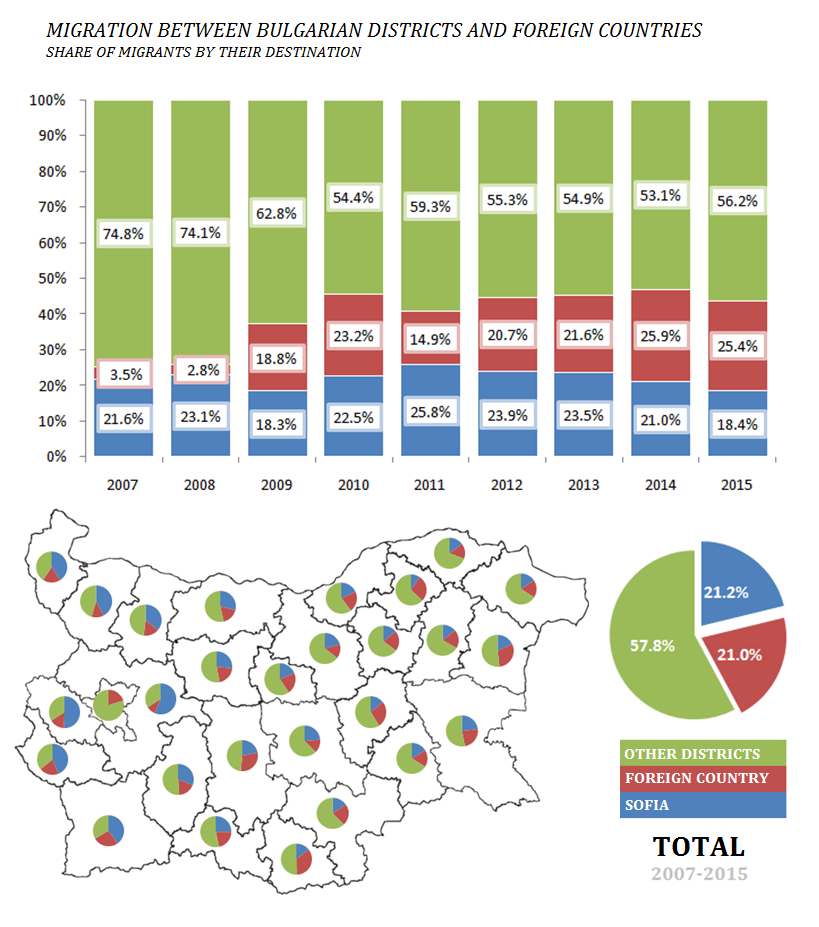
On the background of the frequently discussed data about the external migration of the population, the migration processes in the country itself are often left aside from the public interest. The examination of the data from NSI (National Statistical Institute) for the period between 2007 and 2015 shows, that 79% of the migration is actually internal for the country and migration toward the capital is 2.7 times lower than the total migration toward the other 27 districts.
The mechanical movement of the population between the districts tracks people who have changed their current address. Here, the data describe both the internal and external migration by means of the emigration of the population from a given district. Since 2007 the data of the mechanical movement of people between the districts of Bulgaria include also data about external migration, because of which our focus is exactly on the period 2007-2015. More detailed data about migration to and from each district throughout the years is available on the website of NSI.
In this article, we divide the population of each district into three groups: 1) headed toward the capital; 2) headed abroad; 3) headed toward foreign countries. The individuals who change their current address without leaving the borders of the district, which they inhabited before (for example, a person who moved from Nessebar to Burgas), are not subject to the current analysis.
Source: NSI, calculations of IME
In the time period between 2007 and 2015 the individuals who change their current address, while at the same time leaving the district, in which they reside, constitute almost 743,000 people. Around 157,000 of them move to the capital, and almost 156,000 abroad. The remaining 430,000 change their current address with one in another district of the country.
In each year of the period 2007-2015, over 50% of the people who change their current address, actually go in one of the other 27 districts of the country. The most people move to Plovdiv (47,000), Varna (44,000) and Burgas (34,000), and the least move to Vidin (6,700), Smolyan (5,700) and Kardzhali (below 5,000).
The peak of the migration toward the capital is in 2011, when almost 26% of the individuals who have changed their current address head precisely toward it, and only 15% go abroad. 2011 is the year with the least amount of mechanical movement of the population and the reason is the fall of external migration. In 2011 the number of people who have changed their current address with one abroad drops around three times compared to 2010: from 27,000 to 9,500 people. In the period 2012-2015, however, there is a tendency that more people prefer foreign countries rather than the capital, while in the last two years of the period for the first time a bigger proportion of the population leaves the country rather than moves to the capital.
A quick analysis of the interaction between different socio-economic indicators and the mechanical movement of the population shows moderately positive relation between the migration toward Sofia and the age structure of the population by districts. The greater the age correlation (measured as the ratio between the number of individuals of age above 65 and those of age from 0 to 14, or as a ratio between those of 65 years or above and those in the age 15-64), the higher the proportion of people who have moved to the capital. Vice-versa: the more unfavorable the age structure, the lower the migration toward both foreign countries and other districts.
MIGRATION TOWARD SOFIA
The distance to the capital definitely has an effect on the decision to move to it. The three districts, from which the largest portion of the population in the period 2007-2015 has headed toward the capital, are the Sofia district (56.3%), Pernik (50.5%) and Kyustendil (43.8%). In unison with the tendency of concentration of the employment in the South-West region of the country in Sofia (already above 66% of the employed in the region work precisely in the capital), the most likely cause along with the proximity is the labor migration.
The least are the migrants from the distant Razgrad (9.4%), Sliven (13.9%) and Targovishte (14.1%), followed closely by Kardzhali and Shumen (each with 14.3%). The only districts, from which the migrants in the capital have been less than 10% in any of the years, are Razgrad (in every year of the period 2011-2015) and Kardzhali (in 2015).
There are no clear tendencies of a more intensive migration toward the capital from none of the districts of the country. In accordance with the overall picture, more and more individuals are headed abroad, while a traditionally large portion (above 50% in each of the years) in other districts. However, a gradual fall of the migrants toward the capital from almost all districts in the Northern part of the country can be noticed, including from Vidin and Vratsa, which are among the districts with a traditionally high level of migrants in Sofia. Given the depopulation in large areas of those districts, it is possible that those who had the plans to move have already done it.
MIGRATION TOWARD FOREIGN COUNTRIES
The migration toward foreign countries has its peak in 2014, when 25.9% of the individuals are headed this way. In 2015, this portion falls to 25.4%, which, however, is the second highest for the period. Most significant for the whole period is the migration toward foreign countries from the districts Kardzhali (35.5%), Varna (30.5%) and Plovdiv (29.8%).
In contrast to this data, only one of every five people, who have left Sofia in the period 2007-2015 has gone abroad, while the rest have headed toward other districts. This portion is even smaller in neighboring the capital districts, like the broad Sofia district (only 9.8%) and Pernik (15.4%), from which the greatest amount of people change their current address exactly with one in the capital.
MIGRATION TOWARD OTHER DISTRICTS
A huge part of the capital’s residents, who change their current address, move to the broad Sofia district. Varna continues to be a center of attraction of the population in the North Central and North-East regions of the country, while the districts Plovdiv and Burgas are such for those of the South Central and South-East regions. Precisely this process explains the positive mechanical growth in these districts in the observed period (with the exception of 2009-2010 for district Plovdiv and 2012 for Varna and Burgas). In other words, in those three districts more people continue to immigrate, rather than emigrate.
* Bozhidar Radev is an intern in IME
[1] Due to the fact that the data from NSI shows a change in the current and not the permanent address, it is possible that the same individual shows up in the statistic two or more times in the duration of the observed period.
[2] Although Kardzhali is the district, in which the inflow of people from inside the country is the smallest, it is one of the districts with the most intensive external migration. At the same time the migration of the population of district Kardzhali toward other districts in Bulgaria is relatively low, i.e. the movement of the population abroad and from abroad (of course, mostly from and to Turkey) has a much bigger influence, compared to the other districts.