What If We Exclude Sofia? (2)
Yavor Aleksiev
Two weeks ago we showed what would happen to the country’s average levels of unemployment, employment, and economic activity, provided Sofia was excluded from the calculations. While the deterioration of certain indicators is to be expected, provided the leading economic centre of Bulgaria is not considered, their dynamics suggest some interesting observations. Here we focus on two additional indicators: the GDP per capita (in current prices) and the salaries of employees. Regarding both indicators, the capital city’s effect on the national averages is considerable.
GDP per Capita
If we exclude the capital, the GDP per capita would decline from 11,283 BGN per capita to 8,347 BGN per capita in 2013, or by 26% (Figure 1). In the period from 2000 to 2010 the effect of the capital city on the average per capita GDP increased steadily. Disregarding Sofia would have caused a drop of 12.1% from the national average in 2000, while this figure would have already been 27.9% in 2010. This effect slightly weakened in 2011 and 2012 to 25.8% in order to increase again to just over 26% in 2013.
Figure 1: GDP per capita (2000–2013, BGN)
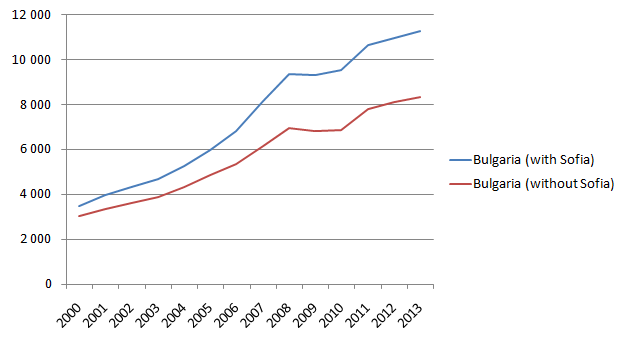
Source: NSI, calculations by IME
If the capital city is not considered, a total of seven districts would surpass the national average level of the GDP per capita. These are Varna, Sofia (region), Burgas, Plovdiv, Gabrovo, Ruse, and Vratsa.
Figure 2: GDP per capita in 2013, BGN
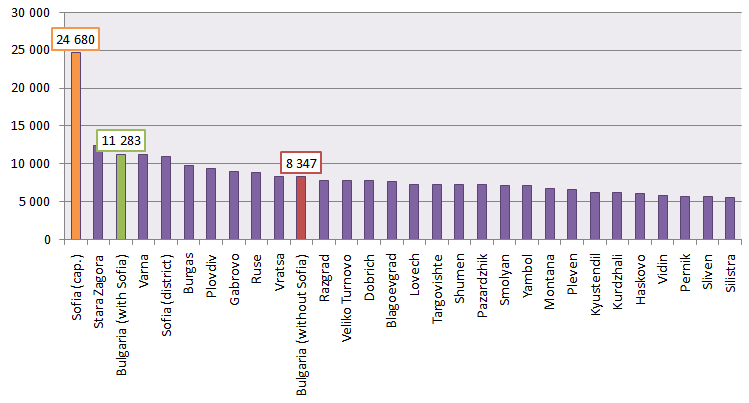
Source: NSI, calculations by IME
Salaries of Employees
Wages in Sofia (cap.) play an ever larger role in determining their average size on the national level. While the difference between the wages of employees, including and excluding the capital city, was barely 5.9% in 2000, in 2013 it was as high as 16.7%. The effect of the capital city’s salaries on the national averages considerably increased from 2006 to 2008 because of the economic boom in Sofia.
Figure 3: Average annual salary (2000–2013, BGN)
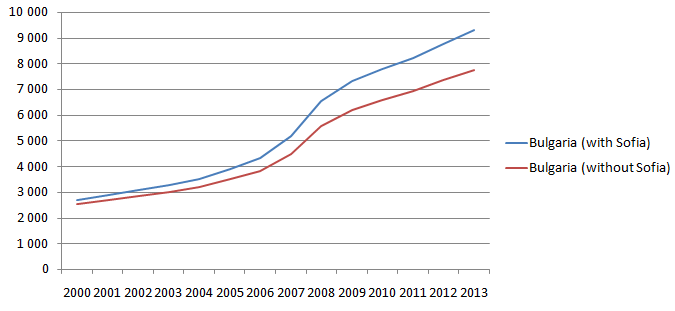
Source: NSI, calculations by IME
If we exclude Sofia (cap.), the average annual wages would have been higher than the country’s average in the districts of Sofia (district), Varna, Burgas, Plovdiv, and Gabrovo. Compared to the year 2000, the districts of Pernik and Kyustendil have lagged the most. These two districts would have reported higher salaries compared to the country average in 2000 if the capital city was disregarded. A possible explanation for that could be the decline of some local industries and also the intensification of the daily labour migration to the capital city. The reason thereof is that the statistics calculate wage levels depending on the place of work, and not on the residence.
Figure 4: Average annual salary (2013, BGN)
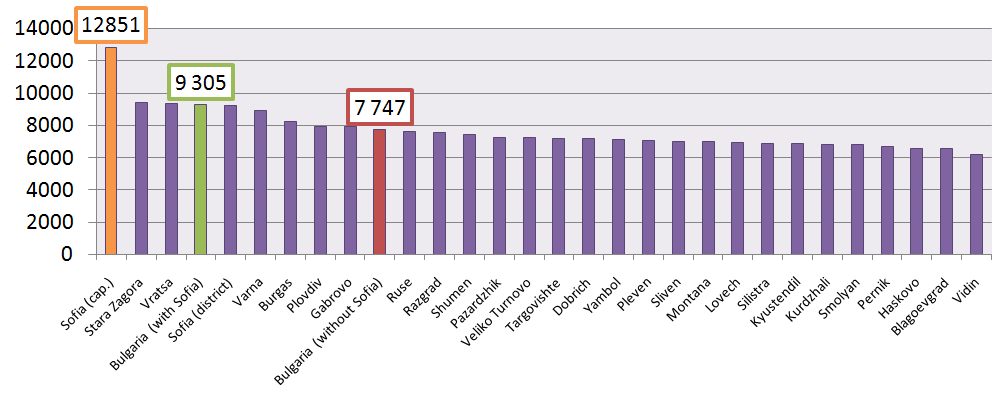
Source: NSI, calculations by IME
These calculations demonstrate that the capital city has an increasing impact on the country’s average values of GDP per capita and wages since the beginning of the new millennium. This effect has increased more slowly since 2008 (regarding wages) and has slightly dropped compared to its peak levels (regarding GDP per capita). Nevertheless, it seems that this trend will also continue in the coming years. One of main reasons for that, of course, is the ongoing concentration of businesses and the increasing population of the capital city. In 2013 some districts, such as Burgas and Plovdiv, succeeded in not only maintaining the growth rate of wages and the GDP per capita of the capital city, but they considerably offset their lagging in terms of investments. Other districts, however, continued to lag behind.
The observations above presuppose higher attention to the implementation of policies based on national-level indicators. Despite the common acknowledgement of this conclusion, its actual implementation has continued to be more of an exclusion than a rule. This constitutes a kind of political and institutional sloth that the regional development of Bulgaria cannot afford.

