Daily Labor Migration Among Disticts 1975-2011
The article will be available in English on October 23th, 2014.
Yavor Aleksiev, Maria Neeva
Daily labor migrants are one of the most important groups in contemporary labor markets, as they illustrate labor market flexibility and to some extent - the mobility of labor resources. These are people who live in one place, but they leave its borders daily to go to work in another. The total number of Bulgarians who travel every day to work is 400.3 thousand people in 2011, which means that about 14% of the workers in the country are with such status. Of them 104.3 thousand people leave not just the boundaries of the settlement in which they live, but also those of the entire district.
Daily labor migrants generally earn their money in one place, but they spend it in another. This way they contribute to the development of their own city (or town, village) and to the diminishing (or at least the slower deepening) of the differences between regions. An increasing share of daily labor migrants in the labor force is often interpreted as an indicator of increasing labor mobility of the population, and in the long term - the overall competition for work force in the labor market. Labor migration data is provided by the Population census in 1975, 1985, 2001 and 2011.
Several trends can be distinguished:
The proportion of daily labor migrants in 1975 and in 2011 is practically the same - 14% of all employees. At the same time, between 1975 and 2011 there is an increase in the proportion of daily labor migrants who leave the boarders of the district in which they live. In the period between 1975 and 2001 that proportion increased slightly from 10.2% to 11.5%. Between 2001 and 2011 this share reached a little over 26 percent, which is evidence of a rapidly increasing labor mobility between regions during the last two censuses.
It is worth taking a look at the distribution of employees depending on whether their work destination is a city or a village. Somewhat opposite to the intuitive perceptions in regard to labor market development a significant part of the traveling workers continue to find employment in villages throughout the whole period between 1975 and 2001. The first significant increase in the share of those employed in cities is not observed until 2011.
Figure 1: Proportion of daily labor migrants depending on the kind of location in which they work (1975-2011), %
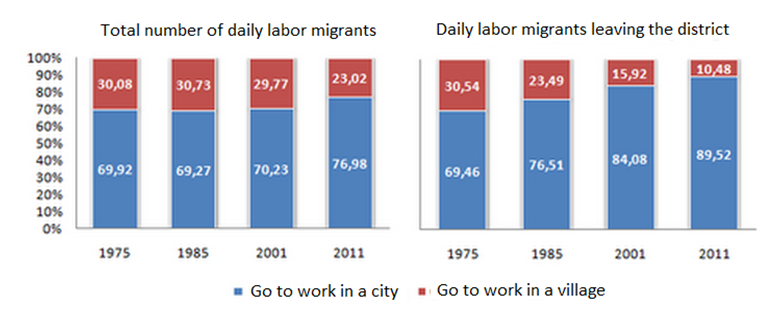
Source: NSI, IME
The reason for this is the already mentioned increase in the proportion of migrants between different districts. The majority of those migrants traditionally leave their district to go to work in a city, which is located outside its boundries.
Labor migration between districts
Although in most areas the number of employees who travel daily as a share of the total number of employed people remains stable, there are some areas in which changes are observed. The most significant changes are precisely between the Census in 2001 and Census in 2011, when the share of daily labor migrants working outside their own district increased in all regions, despite the overall decline in labor migrants in some regions.
|
|
Increase of daily labor migrants (number of people) |
|||
|
Overall increase in the numner of the employed |
Increase of DLM |
DLM, working in the same districts |
DLM, working in another districts |
|
|
Country total |
236 810 |
71561 |
4 996 |
66 575 |
|
Blagoevgrad |
5 282 |
2807 |
1 128 |
1 679 |
|
Burgas |
18 276 |
5435 |
4 470 |
965 |
|
Varna |
37 695 |
2494 |
442 |
2 052 |
|
Veliko Turnovo |
44 |
4597 |
2 794 |
1 813 |
|
Vidin |
-5 000 |
-30 |
-447 |
417 |
|
Vratsa |
-4 670 |
1847 |
-581 |
2 428 |
|
Gabrovo |
-4 732 |
442 |
-434 |
876 |
|
Dobrich |
4 553 |
2323 |
7 |
2 316 |
|
Kurdzhali |
-12 224 |
197 |
-1 866 |
2 063 |
|
Kyustendil |
-2 077 |
-2151 |
-4 371 |
2 220 |
|
Lovech |
-2 369 |
1706 |
-20 |
1 726 |
|
Montana |
-12 530 |
2710 |
665 |
2 045 |
|
Pazardzhik |
8 135 |
6306 |
652 |
5 654 |
|
Pernik |
5 990 |
4194 |
-1 613 |
5 807 |
|
Pleven |
-6 391 |
2951 |
330 |
2 621 |
|
Plovdiv |
33 701 |
11565 |
8 350 |
3 215 |
|
Razgrad |
-10 440 |
2433 |
438 |
1 995 |
|
Ruse |
4 178 |
2854 |
1 815 |
1 039 |
|
Silistra |
-3 727 |
395 |
-903 |
1 298 |
|
Sliven |
-3 107 |
3009 |
882 |
2 127 |
|
Smolyan |
-2 187 |
1512 |
-475 |
1 987 |
|
Sofia |
9 726 |
6098 |
21 |
6 077 |
|
Sofia (cap.) |
157 797 |
-4114 |
-11 125 |
7 011 |
|
Stara Zagora |
15 426 |
2880 |
1 138 |
1 742 |
|
Targovishte |
1 254 |
2538 |
1 337 |
1 201 |
|
Haskovo |
3 530 |
1971 |
189 |
1 782 |
|
Shumen |
442 |
2249 |
802 |
1 447 |
|
Yambol |
205 |
2343 |
1 371 |
972 |
Source: NSI, IME
In absolute terms the largest increase is in Sofia (capital). While in 2001 only 627 people worked outside the district, their number reached 7 011 people in 2011. At the same time, the share of daily labor migrants from the capital (1.22%) remains low.
Figure 2: Number of daily labor migrants working in other district in 2011
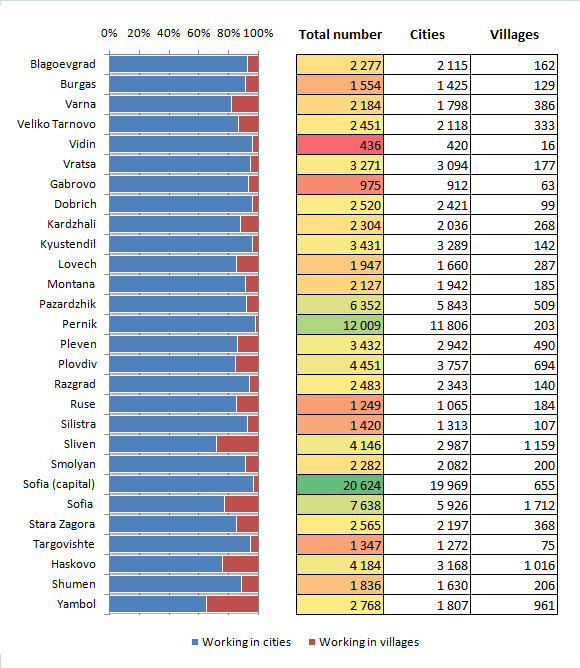
Source: NSI, IME
As in 2001 the largest number of workers in 2011 leaving the limits of the district they live in were from Sofia and Pernik - respectively 20.6 and 12.0 thousand. This movement is due to the fact that the capital city has a strong attraction as the leading business center in the country and respectively - the proximity of the Sofia and Pernik districts to it. The lowest number of daily labor migrants were registered in Vidin - only 436 people.
In the period 2001-2011 the number of employees in the whole economy increased from 2.59 to 2.83 million people (236.8 thousand more), while the number of daily labor migrants between districts increased from 37.7 to 104.3 thousand people (or 66.6 thousand people). This means that for the period between 2011 and 2001 , 28 out of every 100 additional working places went to migrant workers. In some regions, the growth in the number of labor migrants is almost equal to the total decline in the number of people employed. For example, in Smolyan a simultaneous decrease in the number of employed by 2 187 people and a growth of labor migrants by 1 987 people was observed. Thus the daily labor migration contributed to the maintenance of household labor income and the overall rate of employment in smaller areas, offsetting diminishing job opportunities in that region. In some areas, the increase in the number of labor migrants was even higher than the overall growth of the number of employees. For example, in Shumen there was an increase in the total number of employees by 442 people and an increase in daily labor migrants by 1 447 people. This means that some of the people who previously worked in that district started working outside its borders, but did not change their residence.
In the major economic centers of the country the situation is completely different. Despite the increasing number of daily labor migrants, only 4 out of every 100 new jobs in Sofia (capital) in 2011 compared to 2001 went to migrant workers leaving the district. Similar ratios are observed in Burgas (5/100), Varna (5,100), Plovdiv (10/100) and Stara Zagora (11/100).
In all areas of Northwestern Bulgaria the increase of the number of daily labor migrants to other areas was not sufficient to offset the overall decline in the number of employed people. Part of the explanation of that process can be the territorial remoteness of districts such as Montana and Vidin from the strong economic centers in the country – i.e. those that attract additional labor force. Weak infrastructure development (compared to other regions of the country) probably also has a negative effect on labor mobility.
Further increase in the intensity of daily labor migration is essential for sustaining the economic vitality of some of the remotest and poorest areas of the country. The number of daily labor migrants’ dynamics between the censuses in 2001 and in 2011 shows that labor migration between districts is on the rise. This is a trend which will help natural cohesion, or at least - the slower deepening of differences between regions.