How Can We Empower the Regions in Bulgaria?
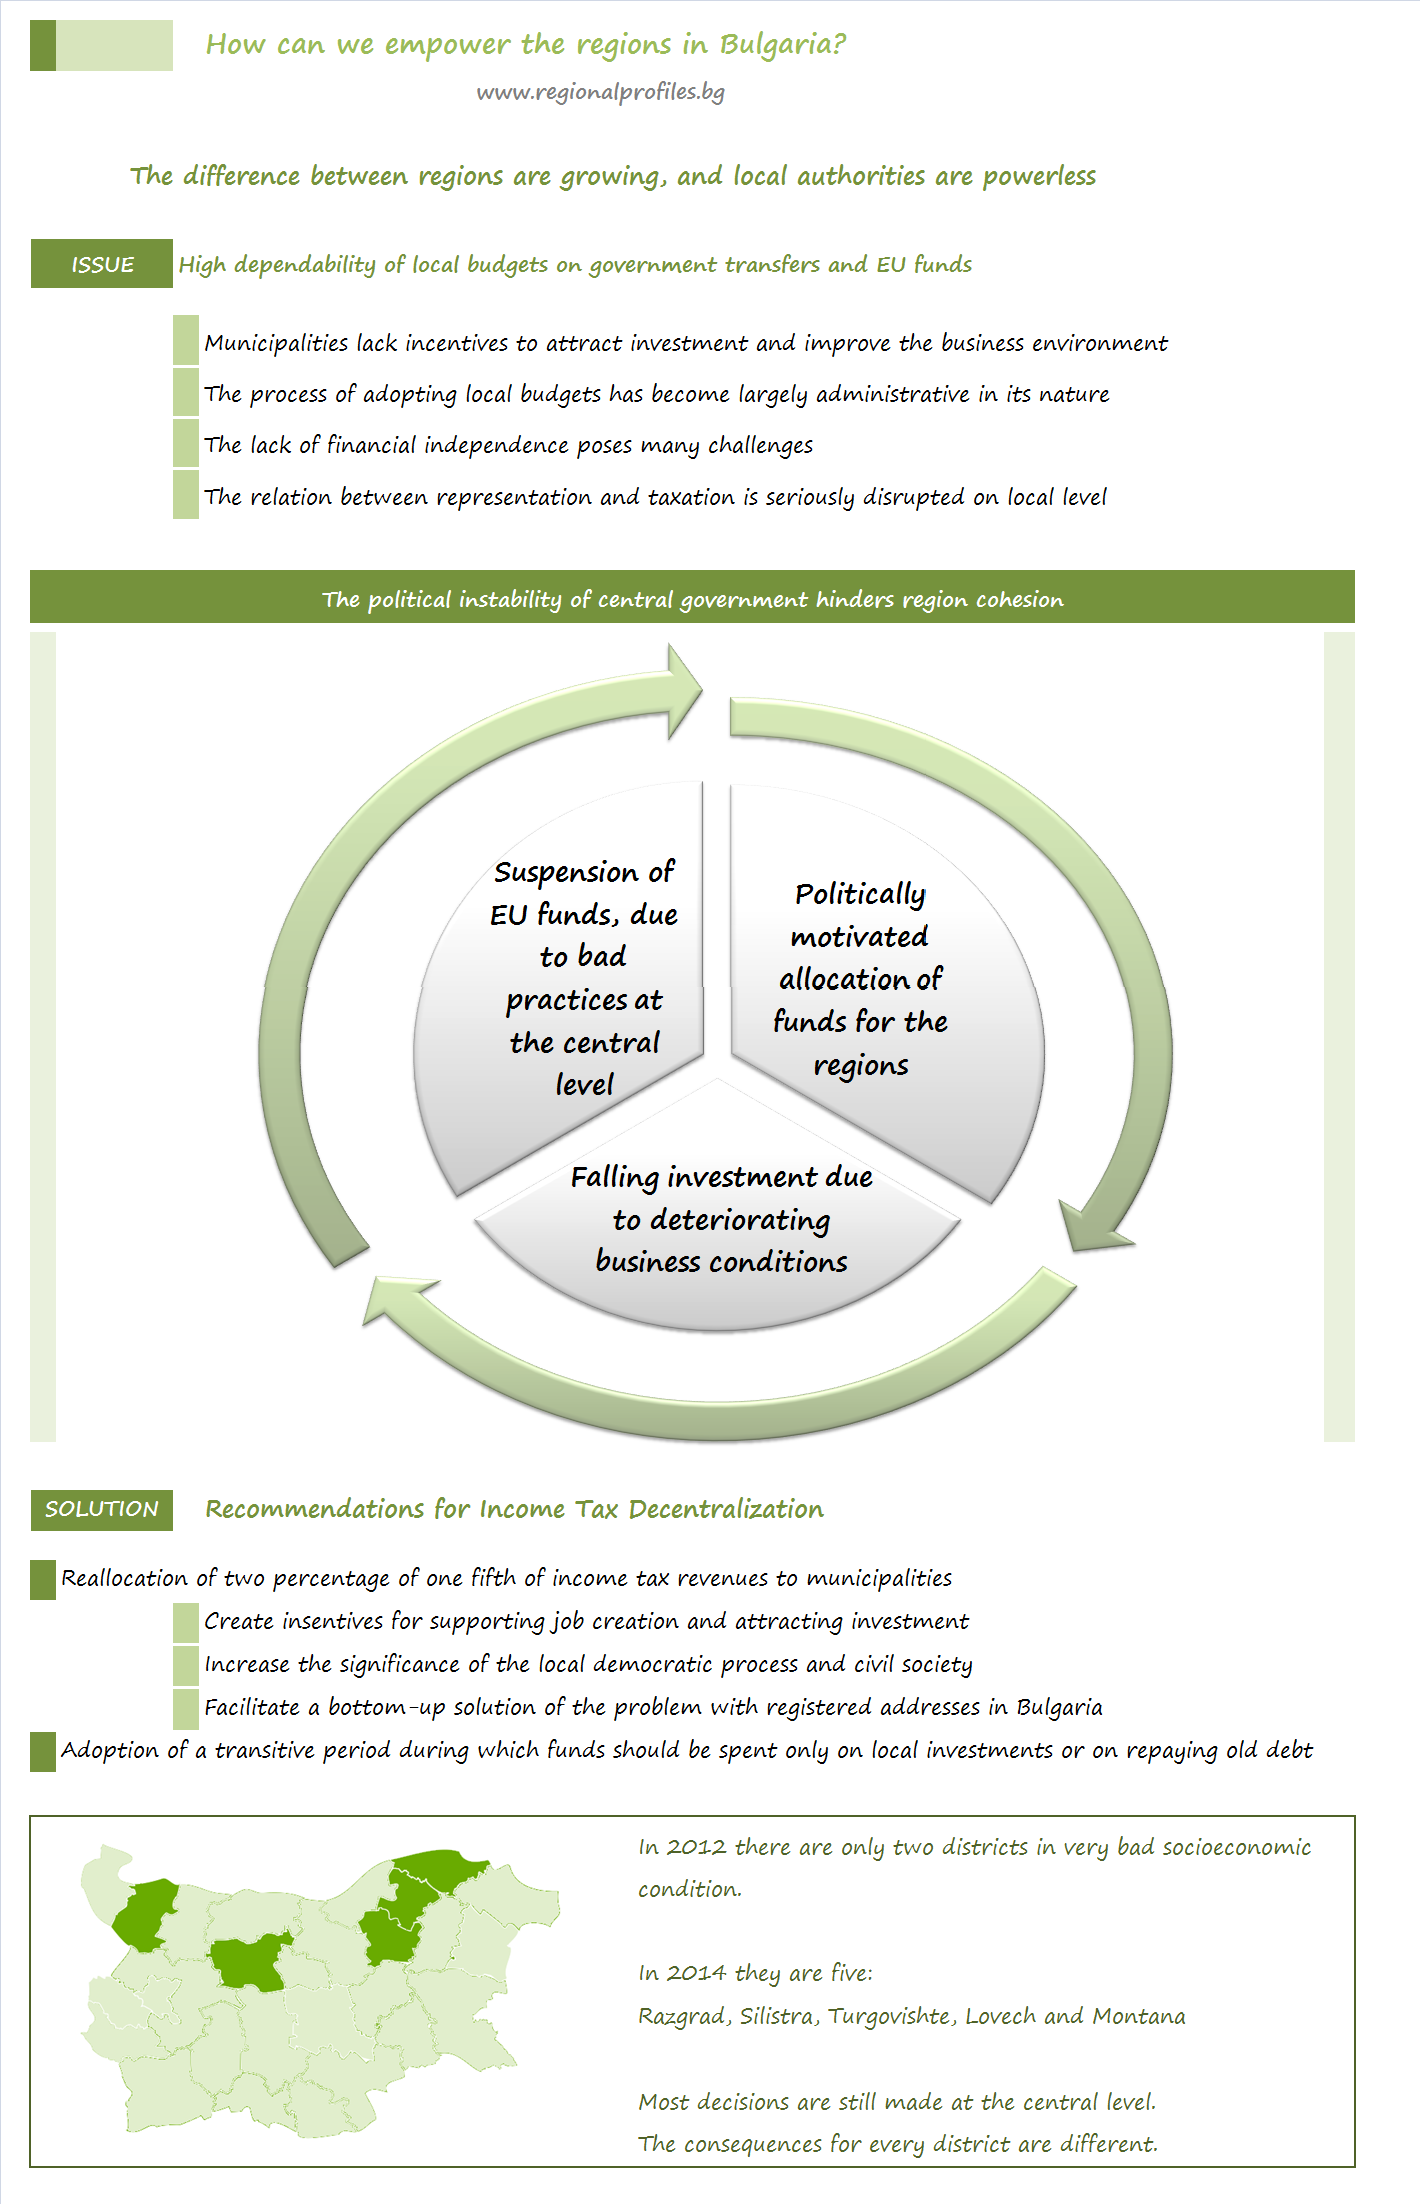
The difference between regions keeps growing and local authorities are powerless.
The difference between regions keeps growing and local authorities are powerless.
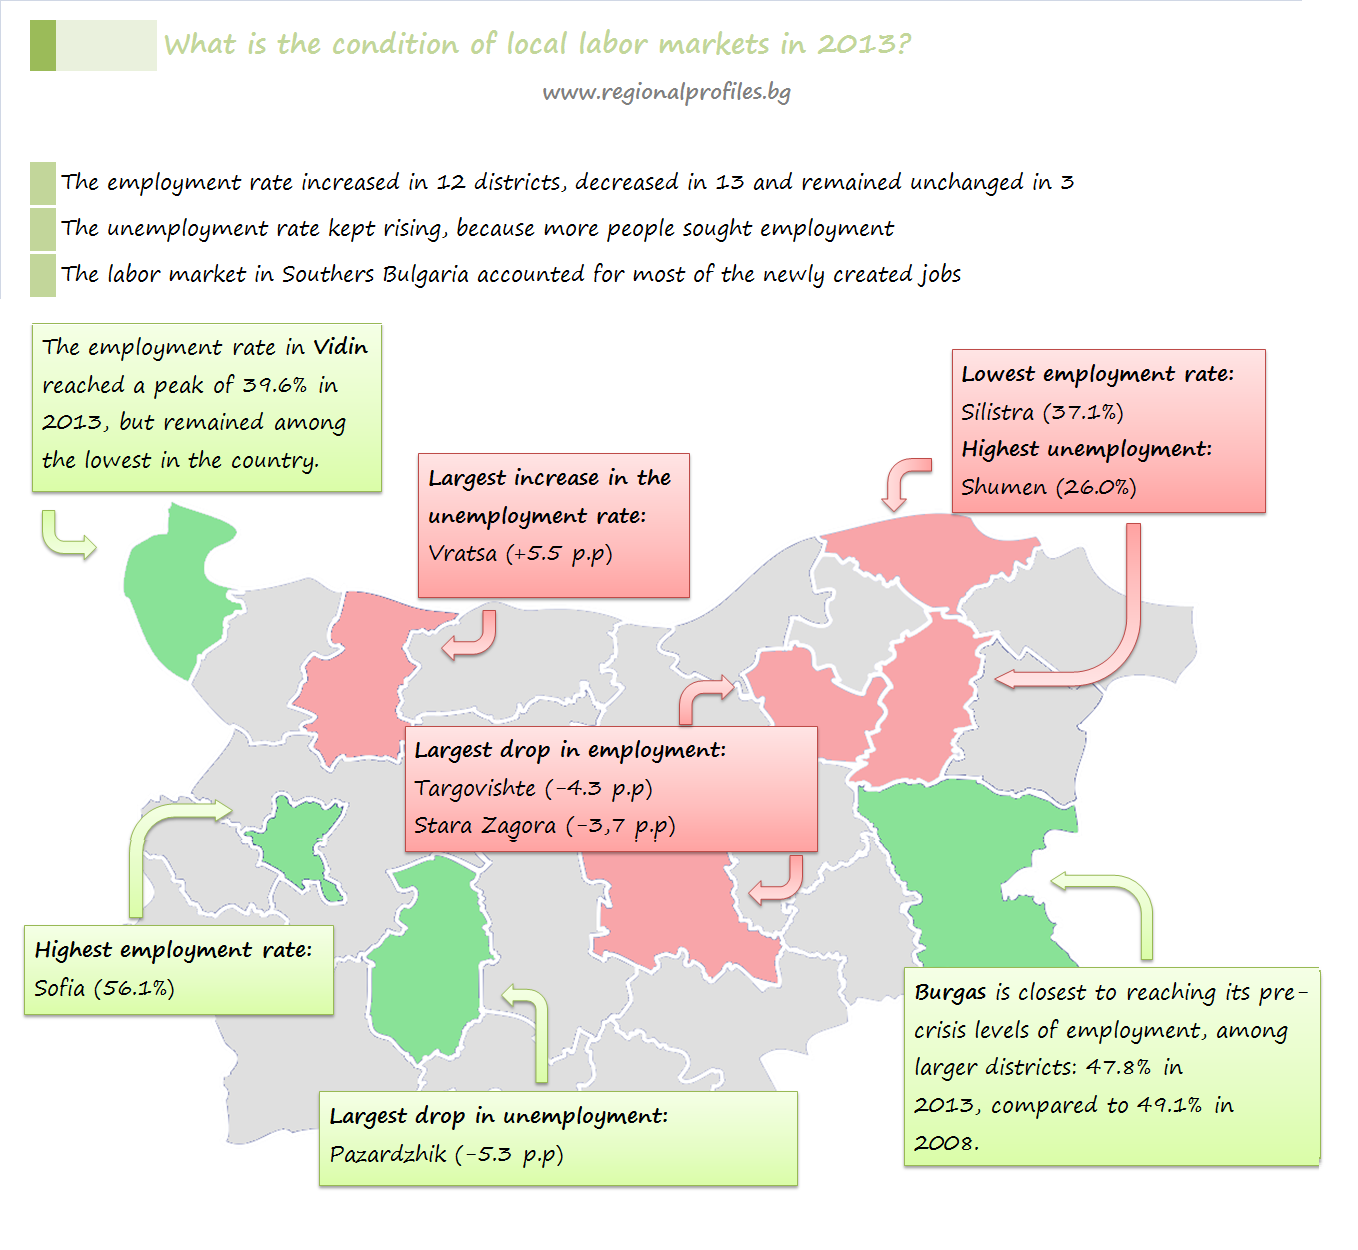
Most of the newly created jobs are found in Southern Bulgaria.
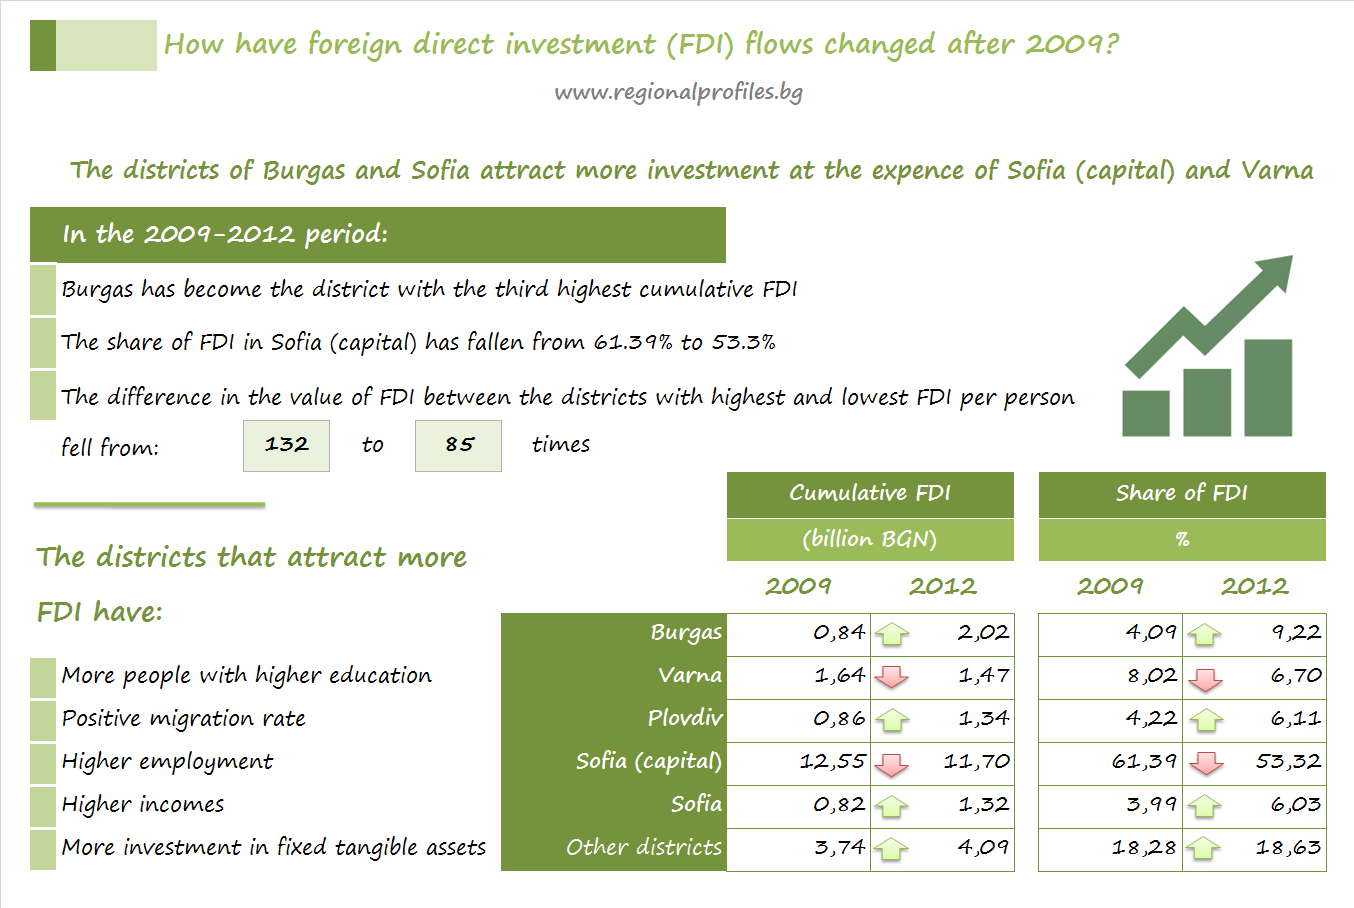
The districts of Burgas and Sofia attract more investment at the expense of Sofia (capital) and Varna.
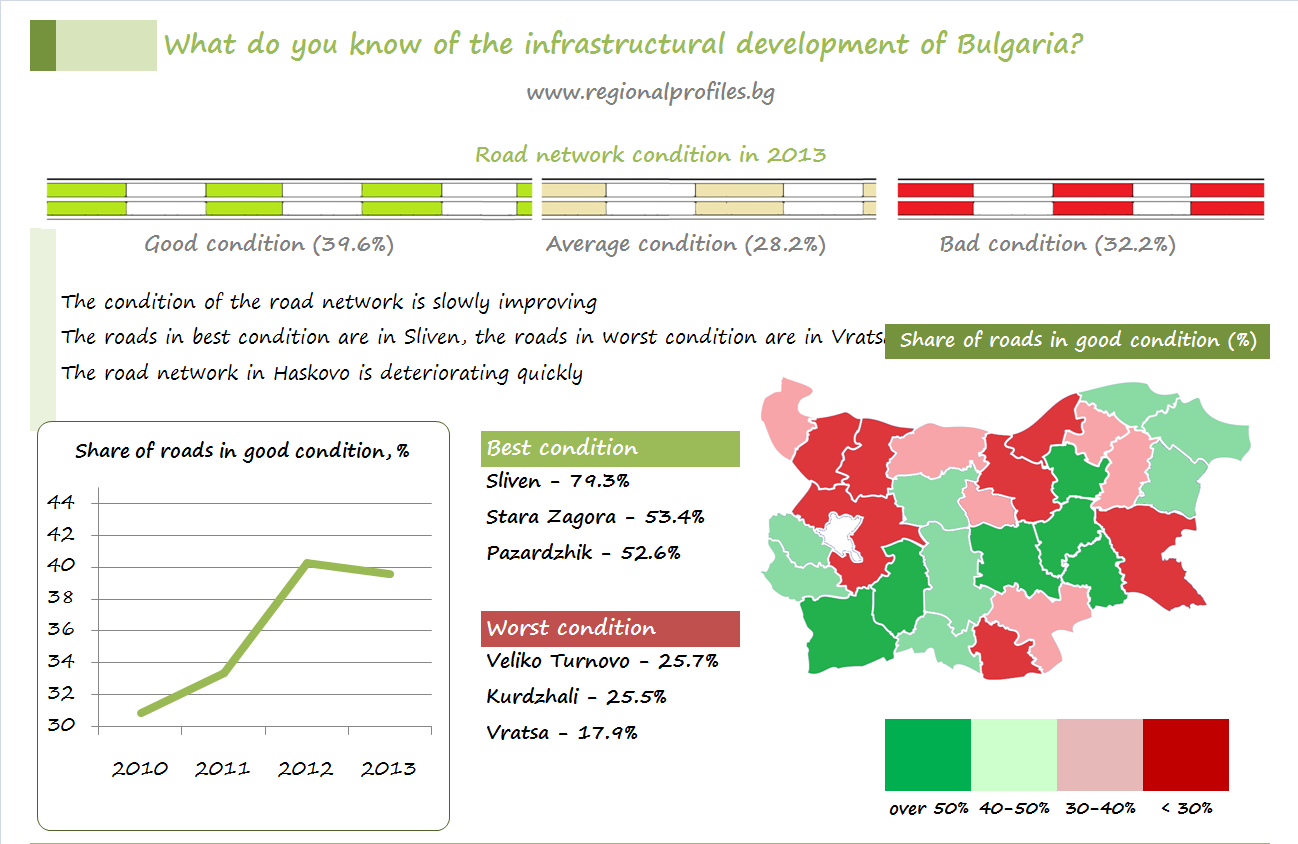
The condition of the road network is slowly improving.
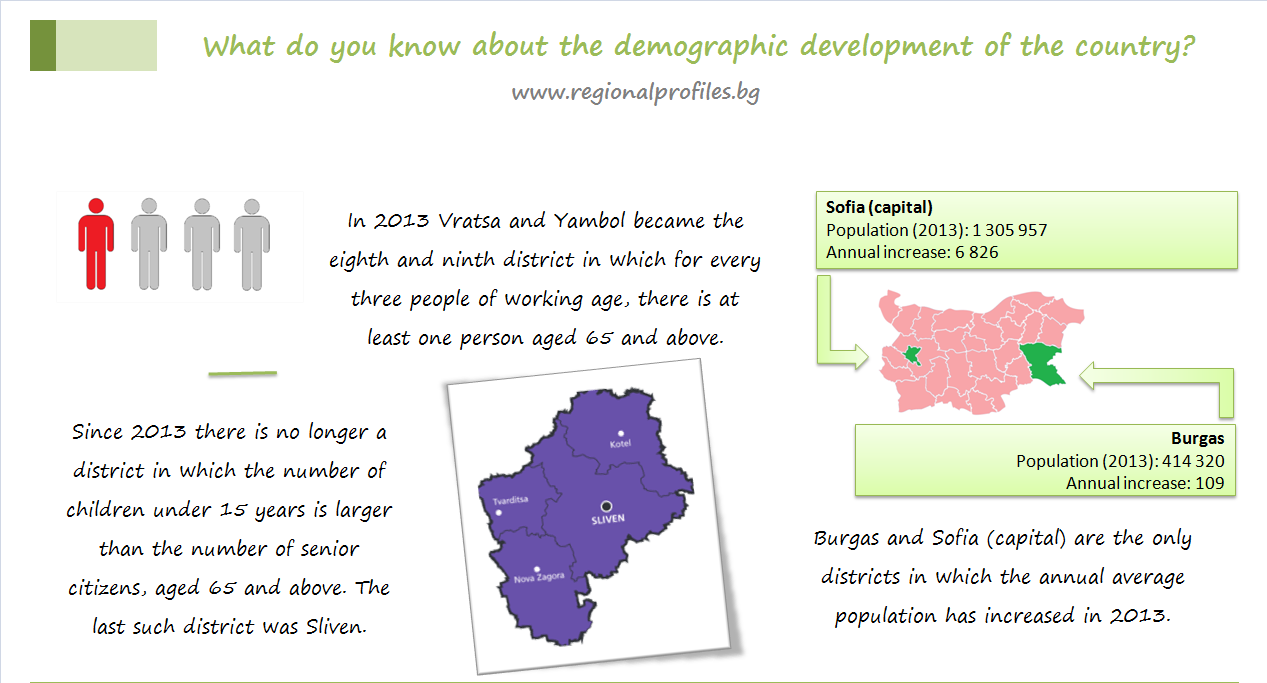
Burgas and Sofia (capital) are the only districts in which the annual average population has increased in 2013.
Public events, dedicated to the third edition.
The Bulgarian edition of the study was presented on November 11th, 2014.
The province is not a problem of the capital — it is a problem of politics 03.04.2026
In 2025, 159 Bulgarian municipalities (60% of all) implemented exactly 400 projects included in the...
All municipal projects can start this year – here's how 04.03.2026
Is it possible for all municipal projects in the state budget – worth a total of over 4 billion euros –...
Regional inequalities are growing 02.03.2026
Deep regional inequality remains one of the most persistent challenges to Bulgaria's economic development....
Sofia for another year breaks away from other regions in economic development 16.02.2026
In 2024, Sofia continues to stand out more and more clearly in its economic development from the other...