Employment and Wage Growth Dynamics in Bulgarian Districts in 2012
Employment in 2012 increased by more than one percentage point only in districts where the average rate of monthly wage increase was lower than the national average.
Yavor Alexiev
A little over a month ago, IME traced the dynamic of the increase in income and unemployment levels in the different districts of Bulgaria.[i] The goal was to determine how the labor market in the various regions reacts to the combination of rising wages and continuously high unemployment. In that analysis, we divided the regions in four groups:
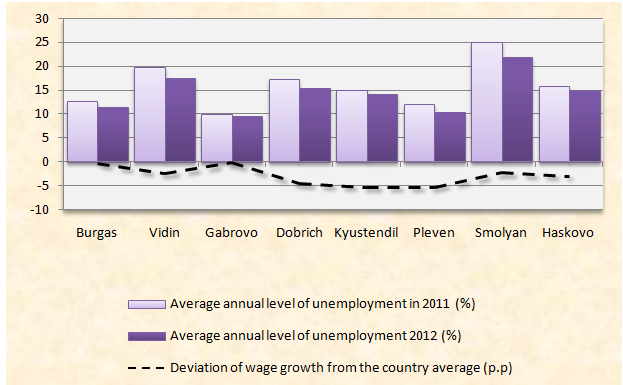
- Group 1: Districts with slowly increasing wages and falling unemployment in 2012: Burgas, Vidin, Gabrovo, Dobrich, Kyustendil, Pleven, Smolyan and Haskovo. In these districts unemployment in 2012 was falling, while at the same time the annual average level of wages increased at a slower rate than the national average.
- Group 2: Districts with slowly increasing wages and rising unemployment in 2012: Blagoevgrad, Varna, Veliko Tarnovo, Vratsa, Lovech, Pernik, Ruse, Sliven, and Yambol. The combination of low rate of increase in wages and the continuous rise of unemployment is evidence of the lack of flexibility on the labor market in these regions.
- Group 3: Districts with rapidly increasing wages and rising unemployment in 2012. In these regions the wages in 2012 have increased at a rate higher than the national average, which is accompanied by the rising unemployment. These are Montana, Pazardzhik, Plovdiv, Razgrad, Silistra, Sofia (capital), Stara Zagora and Targovishte.
- Group 4: Districts with rapidly increasing wages and falling unemployment in 2012 – there are only two districts, in which the rate of wage increases is higher than the national average, without negatively affecting the labor market. These are Shumen and Sofia (district).
Keeping these four groups, in the current analysis we will take a look at what happened with the annual average employment rate of the population above 15 years old.
In times of continuously high unemployment, monitoring the employment level is of crucial importance to the interpretation of the labor market processes, because it shows what part of the population in working age actually has a job. By itself, the fall in unemployment in some regions (if not accompanied by increase in employment) doesn’t show real recovery of the labor market.
Graph 1: Change in the employment rate in the districts with slowly increasing wages and falling unemployment in 2012 (Group 1), percentage points
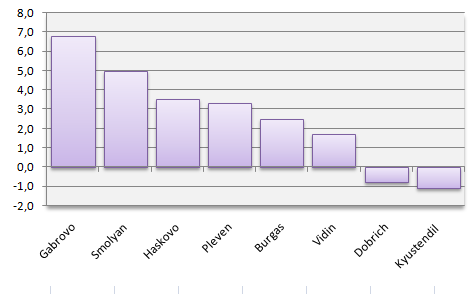
Source: NSI, IME’s calculations
In seven of the eight districts, in which in 2012 wages increased at a rate that is lower than the national average we see a rise in employment. Burgas is the region with the largest number of created jobs – almost four thousand. In Dobrich and Smolyan, the number of employed has increased by 3.3 and 2.9 thousand respectively. Only in Kyustendil employment is shrinking and in 2012 the employed decreased by 1.7 thousand people.
This is also the group with the most favorable labor market development in 2012, manifesting itself in decrease in unemployment and increase in employment. The slower rise in income in these regions helps people keep their jobs and in the same time leads to creating new ones.
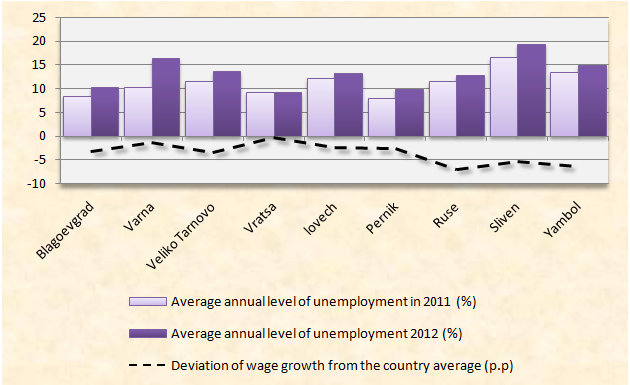
Graph 2: Change in the employment rate in the districts with slowly increasing wages and rising unemployment in 2012 (Group 2), percentage points
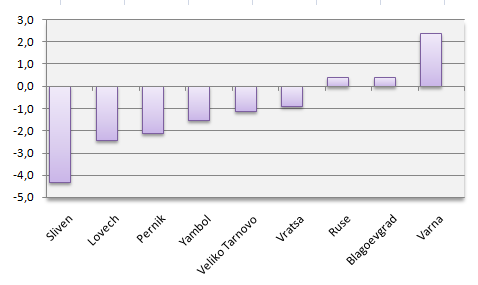
Source: NSI, IME’s calculations
In five out of the nine regions, in which in 2012 we see a simultaneous increase in unemployment and a slow rise in income, employment is also decreasing. This is evidence of a serious lack of flexibility in the labor markets in these regions.
Most worrisome is the situation in Sliven. The minimal increase in income in combination with falling employment and rising unemployment, can be seen as a sign that the labor market does not seem to be able to cope with the administrative increase of wages. This increase in wages affects most of all the districts with lower salaries, such as Sliven.
In addition to Sliven, the rate of increase of the average annual wages is lowest in Blagoevgrad, Veliko Tarnovo, Pernik, Ruse, and Yambol. These are also the districts that show the biggest improvement in terms of employment – in four of them employment increases.
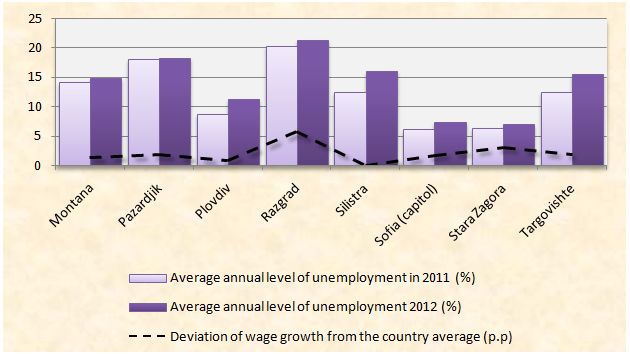
Graph 3: Change in the employment rate in the districts with rapidly increasing wages and rising unemployment in 2012 (Group 3), percentage points
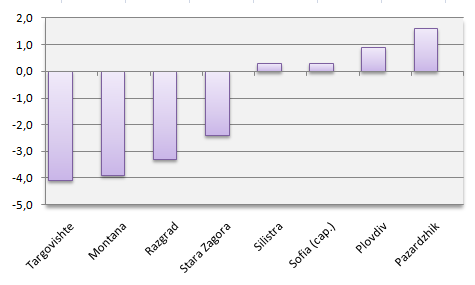
Source: NSI, IME’s calculations
In four of the eight regions, in which in 2012 income levels increased faster than the average national rate and unemployment also rose, we see a fall in the level of employment as well. Only Plovdiv shows a significant increase in the number of employed, but even this district is below the level of 1 percentage point. We also have to note here that in this group the districts that showed an increase in employment in 2012 (Plovdiv, Silistra, and Montana), are also the ones with the lowest deviation from the average national rate of wage increase. In the other five regions wages have a much faster rate of increase, which has a negative effect on employment.
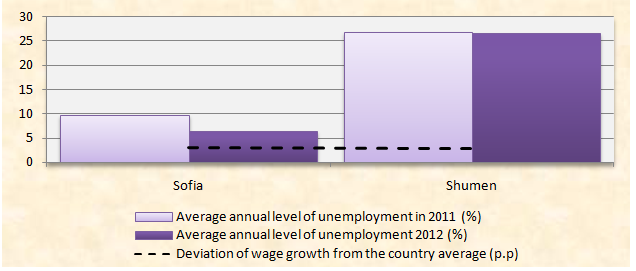
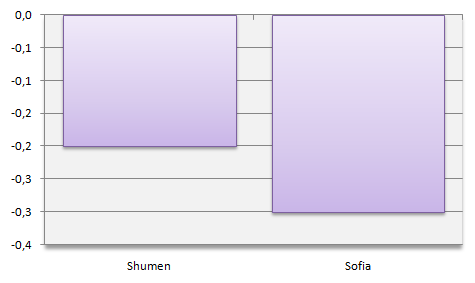
Graph 4: Change in the employment rate in the districts with rapidly increasing wages and falling unemployment in 2012 (Group 4), percentage points
Source: NSI, IME’s calculations
In 2012 there are no significant changes in the rate of employment in the two districts with decreasing unemployment and rapidly increasing wages. Despite the increase in income and employment in Shumen, the district remains one of those with the highest unemployment.
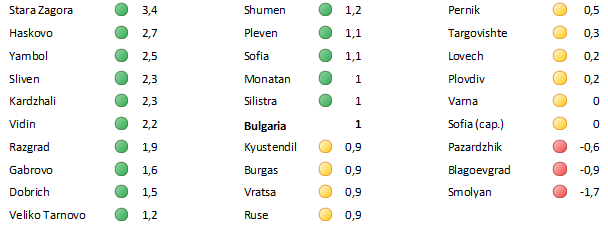
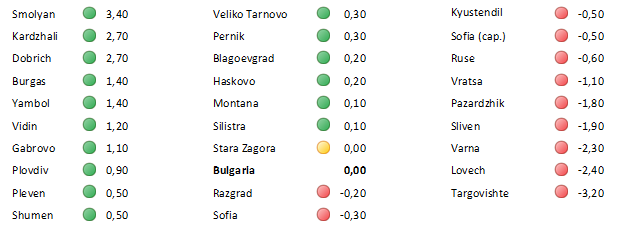
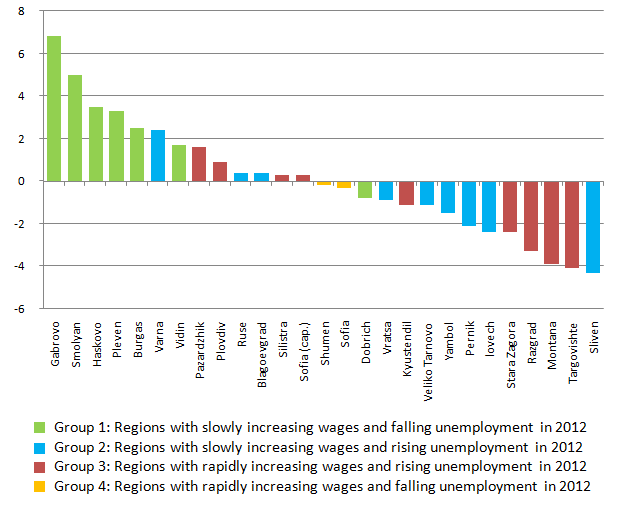
Graph 5: Distribution of the four groups of districts according to the change in the rate of employment of the population above 15 years old in 2012, percentage points.
Source: NSI, IME’s calculations
As is evident, employment in 2012 increased by more than one percentage point only in districts with lower than the national average rate of monthly wage increase.
There is an increase in the employment level in 11 out of the 17 districts, in which wages in 2012 increased at a rate lower than the national average. The slow increase in income in some of the poorest districts in 2012 continues to aid the increase in employment in the same districts since the start of 2013. But in other districts, even the slow rise in wages cannot positively influence employment. In the same in five out of the ten districts, in which the increase in wages is higher than the national average, the average annual level of employment in 2012 waslower than the one in 2011.
Groups 1 and 2 (districts with slower rise of wages) include four of the six regions, in which in the first quarter of 2013 there was an increase in the number of employed in comparison to the end of the fourth quarter of 2012. These are Vidin, Gabrovo, Kyustendil, and Pernik. With the exceptions of Montana and Shumen, employment in the first quarter of 2013 fell in all of the districts of Bulgaria.
[i] To this end we have used data on the monthly salaries of employees under labor contracts in 2011 and 2012. Based on the change of the wages on annual basis (compared to the same month in 2011) we calculated the increase in the average annual wage in each district and its deviation from the national rate of increase. We evaluated this data along with the regional unemployment dynamics.
Due to the insufficient representative data for the labor market conditions in Kardzhali, we have omitted this district from the scope of the previous as well as this analysis.