Higher Local Taxes Are Back on the Agenda
Two of every three tax changes lead to higher taxes
Two out of every three tax changes on a local level are in an upward direction
Yavor Aleksiev
In the period between April 2012 and June 2016 the IME conducted 5 separate surveys of the levels of local taxes and fees, as a part of the project “Regional Profiles: Indicators of Development”. Our requests were sent to all municipalities in the country under the Access to Public Information Act (APIA). The scope of the study includes five types of taxes and fees:
- Immovable property tax for legal entities (‰)
- Vehicle tax – commercial and passenger vehicles, 74 kW to 110 kW (BGN per kW)
- Annual license tax for retailers – up to 100 sq. m. of retail space - for most favorable location of the site (BGN per sq. m.)
- Annual waste collection charge for properties of legal entities (‰)
- Local tax on the sale of immovable property (‰)
Results from the Survey
During the 2013-2016 period we have identified 107 cases of a decrease of local taxes and fees and 209 cases of an increase. This means that two out of every three changes on the local level lead to higher taxes and fees for citizens and businesses. Most probably the actual number of changes (in both directions) is higher than those registered by us, but official and comprehensive information about this is absent. The data we have collected cover around 80% of the municipalities and gives a good enough idea of the changes in the main taxes and fees on a local level.
Number of cases of increase and decrease of local taxes and fees for the period 2013-2016
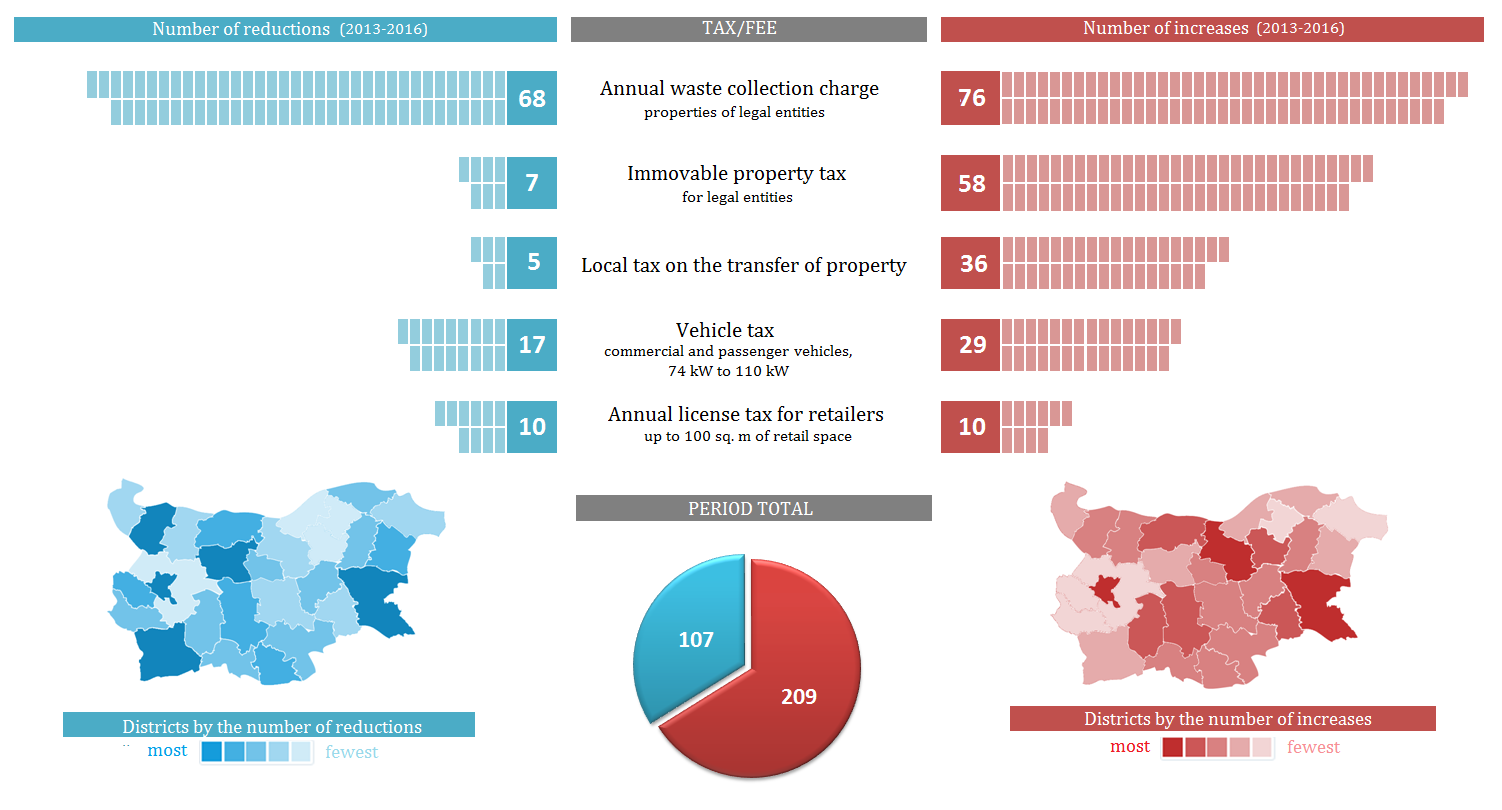
Source: IME, based on requests to the municipalities under APIA
When we last did a similar review (for the period 2013-2015), the waste collection fee and the license tax for retailers proved to have been more frequently decreased, rather than increased. Adding up the data from 2016 as well, however, changes the overall number of increases of the waste collection charge to 76 for the period 2013-2016, while the total number of decreases is 68. In the case of the license tax for retailers the number of increases and decreases equalize at 10. Thus, according to the most recent data that we have, there is no longer a case of a tax or a fee, which has been decreased more times than it has been increased for the period.
It is evident from the data that the trend in regard to the tax on the sale of immovable property and the immovable property tax for legal entities is one and the same – upwards. Both taxes have been increased 7 times more frequently than they have been decreased. Increases in the vehicle tax are also becoming more and more frequent.
The changes during 2016
The problems for municipal budgets in the wake of the crisis and the intensive utilization of EU funds (which implies pre-financing and co-financing from municipalities) obviously had an impact on the fiscal policy of local authorities. According to the information provided by the municipalities themselves, during 2016 there was a record number of increases of local taxes and fees – a total of 81 times. The occasions, in which a tax or a charge was lowered, are barely 17, which is the second lowest value for those 4 years.
Number of changes in the level of the local taxes and charges throughout the years
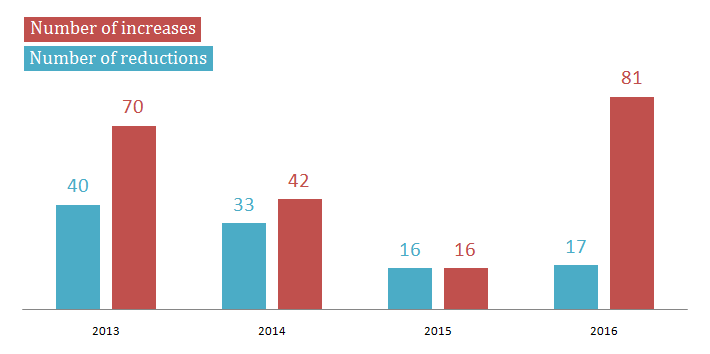
Source: IME, based on requests to the municipalities under APIA
During 2016 there are 25 occasions of an increase of both the waste collection charge and the Immovable property tax for legal entities. The number of increases of the vehicle tax is 15, and that of the local tax on the sale of immovable property is 10. The license tax for retailers has been increased barely 6 times, but this is also a record on this type of tribute, which is among the most infrequently changed.
What are the explanations?
The numerous cases of increase of the amount of local taxes and fees in 2016 act as evidence for the fiscal difficulties of municipalities at the end of the previous programming period of the EU, and indicate the lack of real tax competition between them.
The low share of local taxes in total tax burden on enterprises and businesses places objective limits to the degree of tax competition between municipalities. It is very unlikely that whether the immovable property tax is 1‰ or 2.5‰, for example, is a prerequisite for the movement of investments in and out of a given municipality. The vast majority of the tax burden is tied to the central government, which largely undermines the attempts of municipalities to compete in attracting business (not to mention citizens) by reducing the local tax burden.
The recent local elections as well as the practical discreditation of the process of fiscal decentralization during the fall of 2015 most likely also played their own role in the numerous increases in taxes and fees in 2016. In 2015 the government managed to discredit the concept of fiscal decentralization (linking it with higher taxes) and to shift the whole issue, moving the attention from the insufficient revenues of municipalities to their debt problems. In addition, we have to mention the calls by Prime Minister Boyko Borissov to increase the size and collection of local taxes and charges. Nearly half of the cases of increase (39 out of 81) are in municipalities won by his party – the CEDB. However, given the total number of municipalities in which the party won the elections, this share is rather insufficient to show some kind of pressure from the central government.
Thus, we can differentiate two main reasons for the observed increases in local taxes and charges in 2016:
- Structural reason - lack of real tax competition between municipalities in the country which is a consequence of their limited fiscal powers;
- Cyclical reasons - the end of the previous programming period and its effect on municipal budgets, the passing of local elections and the terminated process of fiscal decentralization.
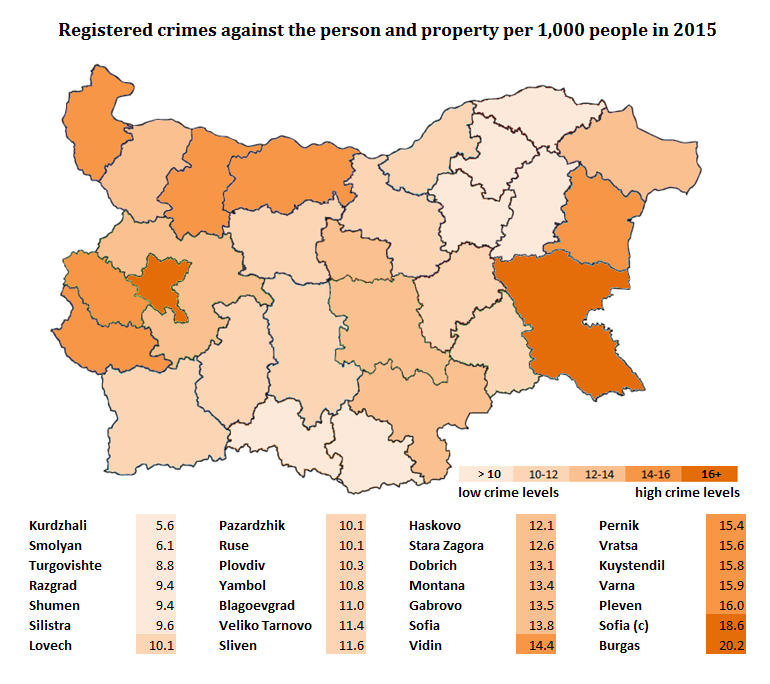
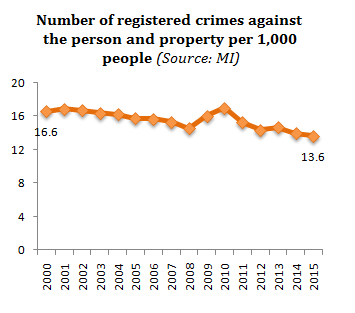 In 2015 the number of registered crimes continued falling and reached 98 thousand in comparison with 135 thousand back in 2000. Crime levels have also decreased in relative terms - from 16.6 per thousand people to 13.6 per thousand people for the 2000-2015 period. This trend was interrupted only during the first years of the crisis (2009 and 2010), during which the number of registered crimes was rising. One possible explanation for the surge in the beginning of the crisis is the quick increase in unemployment and the overall drop in per capita income.
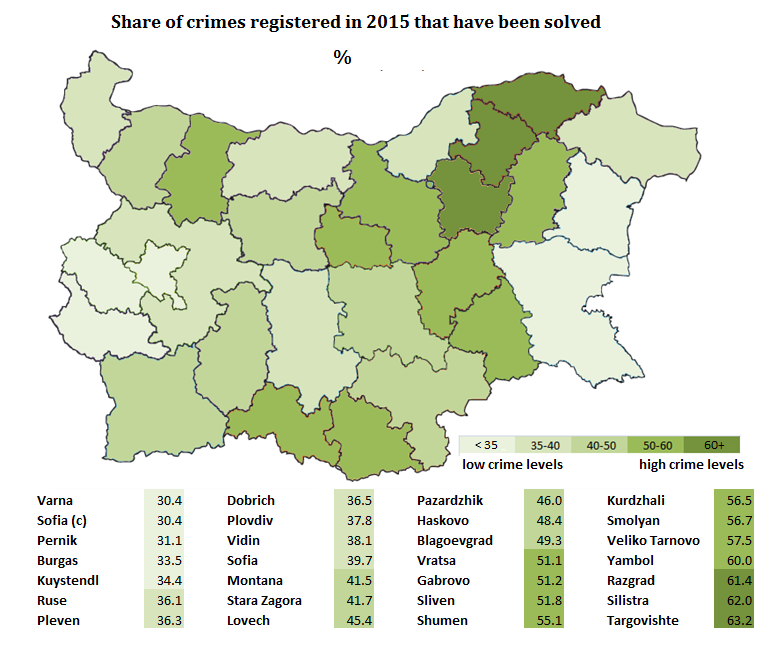
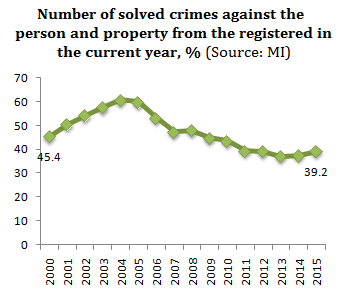 This significant decline in the number of solved crimes can be explained with the lack of reform in the Ministry of Interior (MI) and mainly the fact that its huge budget is being spent primarily for salaries and maintenance and not for capital investment. Additional reasons are the sluggishness and the anachronistic characteristics of the system, the possible existence of corruption and unregulated practices between the MI and the judiciary system.