Employment in the Regions in 2016
Despite the continuing fall of unemployment, job creation has been slowing down in many of the country's regions.
Yavor Aleksiev
The regional analysis of 2016 NSI and EA data for the development of the labor market in the country shows that despite the ongoing decline of unemployment, job creation is gradually losing pace in many regions of the country.
Based on the data published thus far, we expect an average annual decline in the number of the employed aged 15-64 in 2016 with nearly 20 thousand people compared to the previous year. Nevertheless we expect aslight increase in the average employment rate in the same age group – up to 63,4% (compared to 62,9% from the prior year)- due to the rapidly declining population of the country.
On the basis of the quarterly data we can expect a drop in the employment rate by more than 1percentage point in 5 of the 28 districts in the country and an increase of over 1 percentage point in 11 districts.
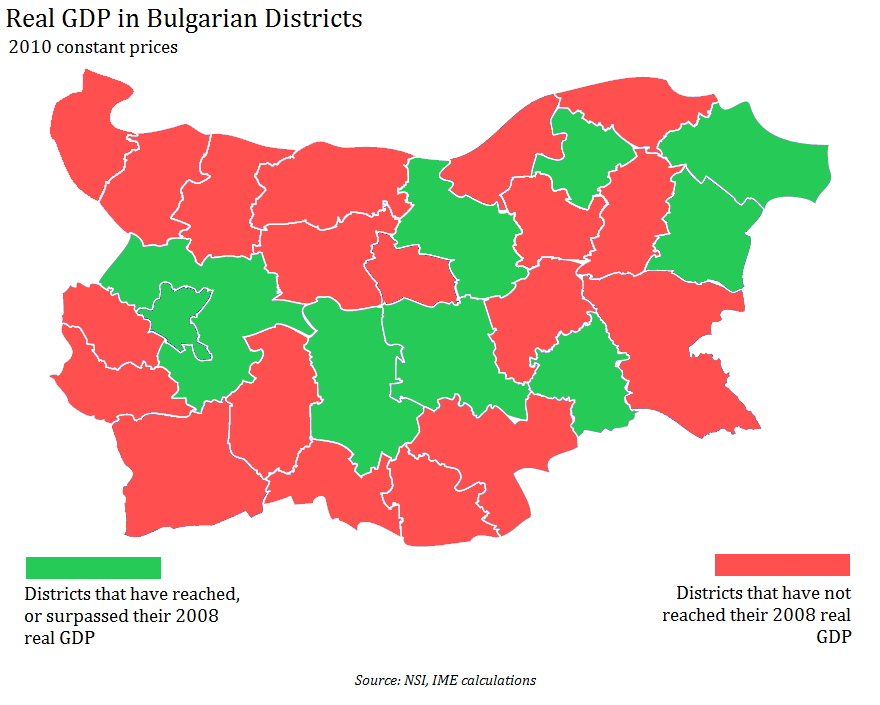
In 2016 the employment rate decreased in all districts of Northwestern Bulgaria – the largest decline is observed in the following districts – Lovech (2.2 pp), Vidin (1.8 pp) and Pleven (1.7 pp). While trends in Vidin and Pleven have been relatively positive, in the other three districts (especially Vratsa) the consequences of the crisis are clearly visible and the employment rate remains far from the pre-crisis levels.
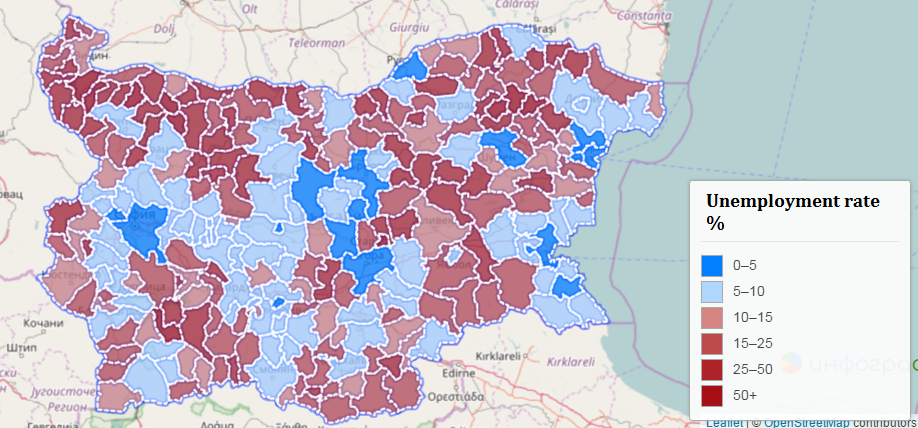
In 2016 Vratsa is expected to register the lowest employment rate since 2005 and so become the district with the lowest employment rate in the country. Lovech (52.4%) and Montana (53.3%) are respectively third and fourth in this negative ranking, while the second place goes to Silistra (52.2%). EA data show that the Northwest region of the country has the largest concentration of municipalities with unemployment rate above 25%. Except for the regional centers Montana, Vratsa, Pleven and Lovech the only other municipality in which the unemployment level is below 10% is Troyan.
Employment in Veliko Tarnovo kept its level from the last year (65%), which is the highest since 2003. The number of the employed people in the district shows a decline for the recent quarters yet still remains above 100,000 people despite the fall of the population of the district. Employment in Gabrovo still remains fairly high although it has not reached the levels of 2008 -2009.
The most stable positive trend of employment growth was observed in the district of Razgrad, yet due to the low base it remains significantly lower than the average for the region and for the country. After a long crisis period, improvement was observed in two other districts of the North Central Region - Ruse (in 2015 and 2016) and Silistra (2016). The latter, however, remains with the second lowest employment rate in the country. Ruse, in turn, marked seventh consecutive quarter of growth in the number of employees on an annual basis at the end of 2016, although the pace of job creation is gradually slowing down.
All districts in the Northeastern region of the country, with the exception of Varna, recorded an increase in employment in 2015 and 2016. Dobrich and Shumen respectively reached the record-breaking 62.6% and 61.2%.
Employment in Targovishte has increased for three consecutive years, reaching 53.6%, but remains far from the pre-crisis levels and is among the lowest in the country. After registering a record of 68.4% in 2015, employment in Varna declined to 65.9%. Nevertheless, it remains the highest in the region and the fourth highest in the country.
The Southeastern region of the country is the only one in which the employment rate in 2016 grew in each of the districts. The recovery of the labor market in Burgas ended (in line with the IME forecasts) and now we can safely talk about an expansion. The average employment rate will be higher than the one from 2015 and will reach a record of 63,6%. The expansion also covers smaller municipalities such as Kameno and Aitos in which the unemployment rate (according to EA) in 2016 droped below 10%.
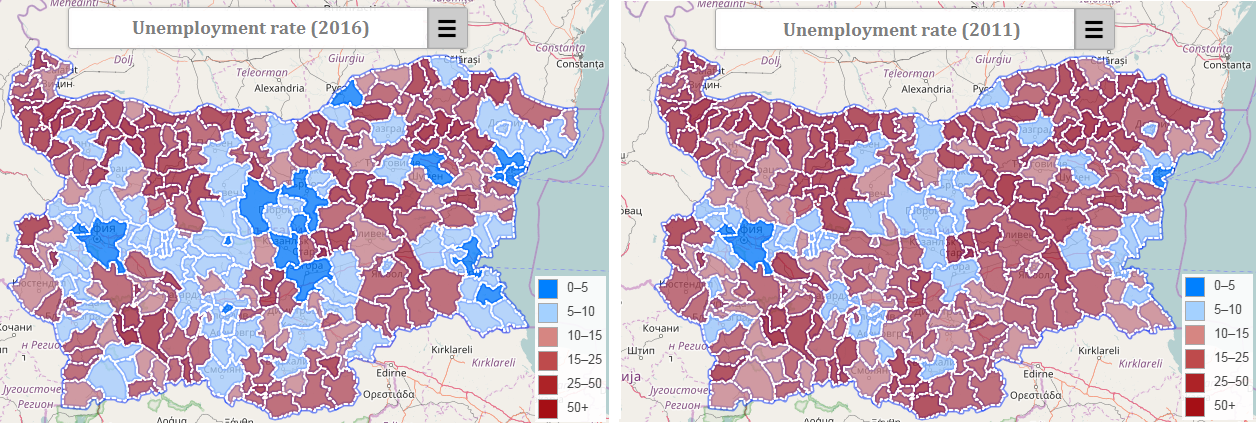
The data on the development of the labor marker in the other three districts (Sliven, Stara Zagora and Yambol) are also positive, given the fact that Yambol has surpassed and Sliven is approaching its pre-crisis level of employment. At the same time, the only municipality in the district of Sliven where the unemployment rate in 2016 was below 10% is Nova Zagora. Despite being part of the district of Sliven, its territorial location between the regional centers Sliven and Stara Zagora and the data for the daily labor migration show that its economy is rather bounded with the Western district - Stara Zagora. The labor market in the district of Stara Zagora continues to be fragmented and in the two of the municipalities, Kazanlak and Stara Zagora, unemployment is below 5% and in Radnevo and Galabovo - below 10%. The situation in municipalities such as Maglizh, Nikolaevo, Gourkovo and Bratya Daskalovi still remains critical, given the fact that in some of them unemployment is even above the levels of 2011.
The past year can be considered rather uneventful in terms of the employment in the South Central region of the country. Employment in the districts of Plovdiv and Smolyan remained stable, but is still about 1 percentage point lower than its peak in 2008. Quarterly data for both districts, however, clearly shows a gradual deterioration in the second half of 2016, as the number of people employed in both of them has decreased on an annual basis.
Positive trends were observed mainly in the district of Haskovo. The employment rate reached pre-crisis levels and unemployment in the district center and in Dimitrovgrad is declining. Pazardjik registered a modest increase of the employment rate up to 60.3%.
Though we expect the average annual number of the people employed in the capital city to set a new record, the gradual increase in population means that the capital city has not reached its pre-crisis employment rate (73.9% in 2008). It is Sofia (capital), however, that is the main engine of the process of the job creation at a national level in 2016.
The data are positive for the districts of Blagoevgrad and Kyustendil are also positive as the latter is already approaching pre-crisis levels of employment of the population aged 15-64. Employment in the big district of Sofia and Pernik decreases as quarterly data suggests an improvement at the end of the year for Pernik and further deterioration in Sofia (district).
In conclusion
IME’s assessment of the labor markets in 2016, prepared on the basis NSI and EA data, shows that job creation is slowing down or has stopped altogether in many of the country’s districts. The data on the development of the labor market in the Northwestern part of the country is extremely worrying, especially in regard to the districts of Vratsa, Lovech and Montana. The only region in which we observe a growth of employment across the board is the Southeastern one, though the recovery of some districts (such as Stara Zagora) remains extremely uneven.
The average annual rates for 2016 which we forecast relate to the employment of the population aged 15-64 and are based on a quarterly data from NSI.
 November 29th, 2016 | 11:00 - 12:00