A Profile of Danube Municipalities
The IME took part at an international forum in Ruse
Yavor Aleksiev
On June 29th 2017, representatives of the Institute for Market Economics (IME) took part in a forum hosted in the city of Ruse, focused on socio-economic analysis on the status of the Danube municipalities. While the forum itself was dedicated to the Celebration of the river Danube, a great deal of ideas were discussed - mainly concerned with infrastructural, international projects, changes in regulations and initiatives as well as improving the competitiveness of the local economy.
Some of the main problems facing the local municipalities are the low level of infrastructural development, which directly influences investment activity and labor migration among different regions. As a result the main social consideration is migration, which remains high.
The primary goal of this article is to investigate the economic and social conditions of the Danube municipalties.
Economic Zones and Income
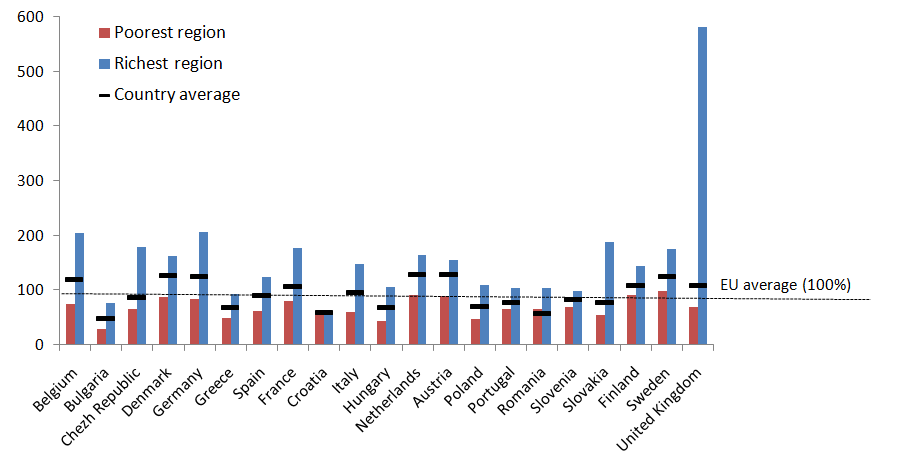
Along the Danube river three main economic centers are formed – Ruse, Kozlodui and Pleven. The average per capita income has a rather slower growth than the national average, this is particularly true for the municipalities which form economic zone “Kozlodui”. However, upon a closer investigation one would clearly see that the average wage there is higher than the average national wage in 2015 data (BGN 1,465 gross monthly wage), primarily because of the higher wages of those employed at the ‘Kozlodui’ Nuclear Power Station. Wages in Ruse (BGN 719) and the neighboring municipalities are much closer to the national average ones (BGN 878) compared to those in Pleven (BGN 666). Their growth however is falling behind the country average mostly due to the effect of the capital on the country average.
Demography
Between 2000 and 2016 the population of the Danube municipalities fell by nearly a quarter - twice faster compared to the national average. The only municipality where the negative trend is less pronounced is Ruse where the decrease is 11%. Other district centers like Vidin and Silistra have lost about a third of their population. Furthermore, in smaller municipalities like Bregovo and Nikopol the decrease is surpassing 40%. In 2016, around 60% of the Danube population was living in Ruse, Vidin and Svishtov. Aside fro the negative population growth, there are also negative migration trends. Despite this in some municipalities there are positive migration dynamics, but those are not sufficient to reverse the overall trend.
Investments
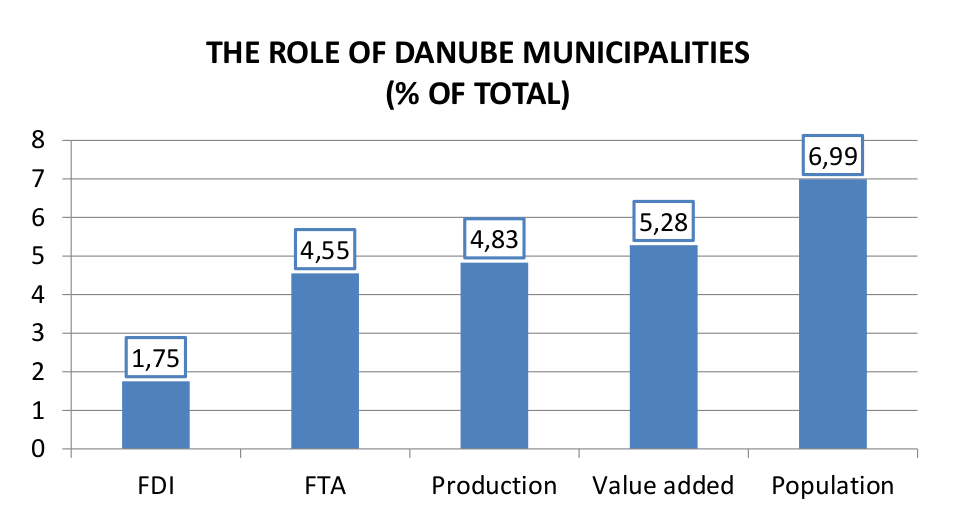
The key problem for the development of the region is the apparent lack of foreign direct investments (FDI). In the 23 municipalities along the Danube live almost 7% of the population of Bulgaria, but the amount of FDI in late 2015 was just 1,75% of the country total. Nearly 75% of all FDI are concentrated in Ruse municipality but ii is still about one third less compared to the country average EUR 3,000 per capita (accumulated at the end of 2015).
Examples of investors with growing revenue and number of employees are certainly not absent, but they are concentrated in the industry of Ruse municipality. Another important measurement of investment activity – the expenditures for obtaining long term material assets has an underlying slow but steady growth. However, in 2015, it remained 11% lower compared to 2011 results as well as below the country average.
Education and labor market
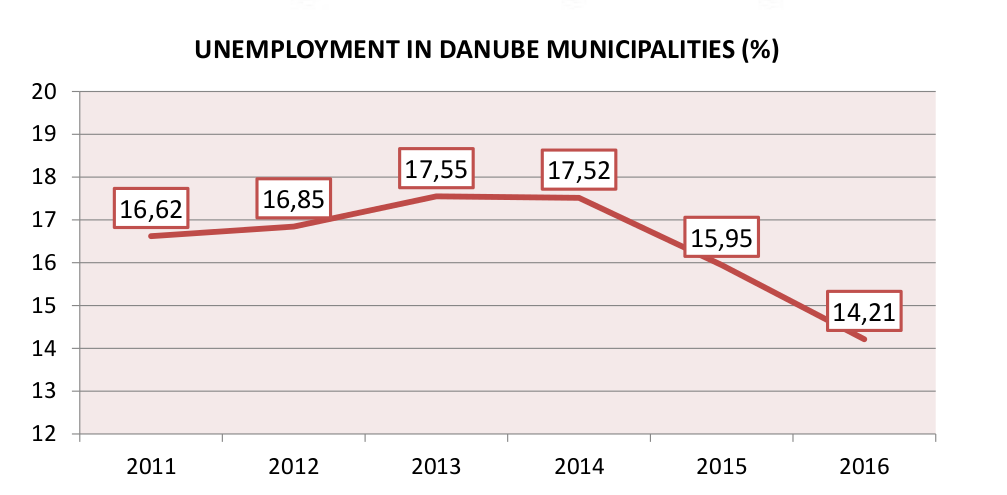
The labor market is quite fragmented. Despite three consecutive years of downward trend, unemployment remains high, peaking at 14,21% in 2016. Almost half of the Danube municipalities have reached serious unemployment levels of over 25% and in some cases, six to be precise, over 30%.
The lowest unemployment levels are in Ruse municipality (4%), while the highest one is in Dimovo municipality, which has a staggering 59% unemployed. Despite the free manpower in many of the smaller municipalities, daily labor migration remains relatively limited, which could be linked to the educational profile of the population on one hand and with the ever worsening state of the infrastructure on the other. The daily labor migration among the municipalities is estimated to be around 6% of the employed, compared to a country average of 8%.