The Labor Market in 2013: Positive Data and Dim Outlook
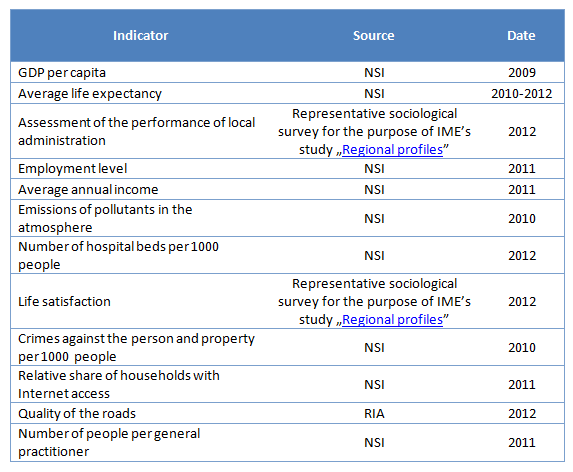
The results of an IME business survey, carried out in the build-up to the study “Regional Profiles: Indicators of Development 2013” (to be published in November), indicate rather negative trends for the development of domestic labor markets in the next 12 months.
Yavor Alexiev
It appears that the Bulgarian economy has finally started to create jobs. In the second quarter of 2013 the number of employed people was 26,5 thousand higher compared to the same period last year. Meanwhile, slowing economic growth could have a reverse effect on this much awaited positive trend. The results of an IME business survey, carried out in the build-up to the study “Regional Profiles: Indicators of Development 2013” (to be published in November), indicate rather negative trends for the development of domestic labor markets in the next 12 months.
Seasonal employment plays an important role
According to the data published this month by the National Statistical Institute (NSI), the increased number of employees in seasonal industries (agriculture, hotels and restaurants etc.) during the second quarter and the growth is significantly higher than the observed growth during the previous couple of years. In comparison to 2012, there are 13 thousand newly created jobs in agriculture and 14 thousand in “Hotels and Restaurants” .Therefore, it is hard to make a definite conclusion whether these new jobs in recent months are due to general improvements in the economy or just temporary effects as a result of a strong summer season.
The dynamics of the number of employed for the first two quarters in different regions of the country also point to rather strong seasonal trends. For the period April-May 2013 most openings have been created in districts with traditionally high occupation during the summer months. Compared with the first quarter of the year, the average number of employees under labor contract during the second quarter increased by 16,8% in Burgas, 7,8 % in Varna and 8,8 % in Dobrich. Other districts with good performance this year are Targovishte and Shumen. However, the increase in the number of employees there is only 2-3%. In 2012 these rates were 13,9% in Burgas, 7,0% in Varna and 5,7% in Dobrich.
Business Expectations
In spite of the positive signs of growing employment, businesses are not quite as optimistic about the situation on the labor market in the country for this year and next.
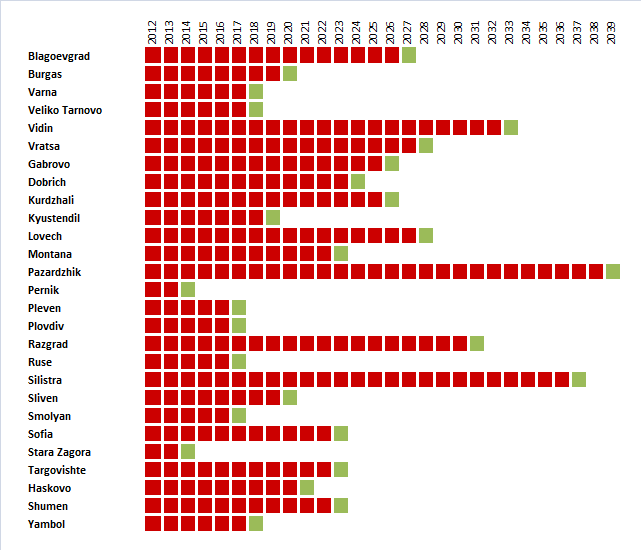
For the purposes of the upcoming second edition of the study “Regional profiles: Indicators of Development”, in May 2013 IME conducted a survey among 1680 companies nationwide. One its goals, was to examine the expectations of businesses regarding the dynamics of the number of employees in the period June 2013-June 2014. The results are shown in the graph below, by visualizing the expectations of business representatives about increasing or decreasing the number of their employees. Results above 3 show expectations of hiring more staff. Result below 3 point to negative tendencies.
Business expectations regarding the number of employed (June 2013 - June 2014)
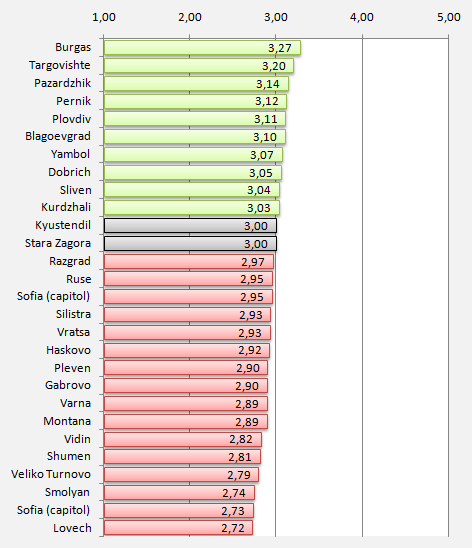
Source: IME, „Regional profiles: Indicators of Development 2013“
Note: The data is from May 2013.
Businesses expect that the number of employees will increase in the following 10 districts: Burgas, Targovishte, Pazardzhik, Pernik, Plovdiv, Blagoevgrad, Yambol, Dobrich, Sliven and Kardzhali. Oddly enough, only Dobrich and Targovishte are part of Northern Bulgaria. There is no expected change in the number of employees in Kyustendil and Stara Zagora and in all other districts this number is expected to fall.
Too Early for Evaluations
It seems more than clear that an exact assessment of labor market conditions in Bulgaria could be made at the end of the third quarter, when most of the seasonal workers will be dismissed. The question is whether the momentum in the labor market and perhaps in the economy in general will be sufficient to keep employment high in comparison to previous year. The successful summer season makes evaluations based on the dynamics of previous years uncertain. Employment numbers may be positive but so far business expectations remain subdued.
 Raising the minimum thresholds makes the labor of more than half of the employed in poorer districts more expensive.
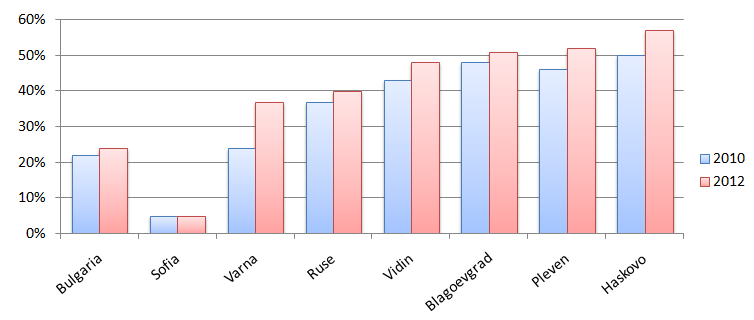

 �
�
