Sofia Generates Most of the New Jobs
A review of EA data shows that there is a high relative share of vacancies, which offer a minimum wage (29.3%).
Yavor Aleksiev
The analysis of the open data of the Employment Agency (EA) largely confirms some already established trends in the labor market. As of 9 November 2017:
- There are 13,205 vacancies, across 3716 job posts, 86% of which are for open-ended employment contracts;
- The proposed weighted average gross salary for an 8-hour working day is BGN 669, which amounts to 65% of the country’s average salary (BGN 1027 according to the latest data from June 2017);
- At the district level the proposed weighted average gross salary ranges from BGN 515 in Yambol to BGN 1049 in Smolyan, where there is a serious demand for metalworkers and welders (in very good financial conditions). The proposed average salary in the capital is the second highest – BGN 815.
Despite Smolyan‘s current top ranking in terms of average wages proposed, the capital continues to be the district concentrating a large part of the vacancies both in general (26.5%) and in the high-paying job offers. Sofia generates only 18% of the minimum wage jobs and 51% of those offering over 1000 BGN. More than half of the job posts in the capital are for over BGN 750 pay.
Number of vacancies depending on the salary offered (as of November9th, 2017)
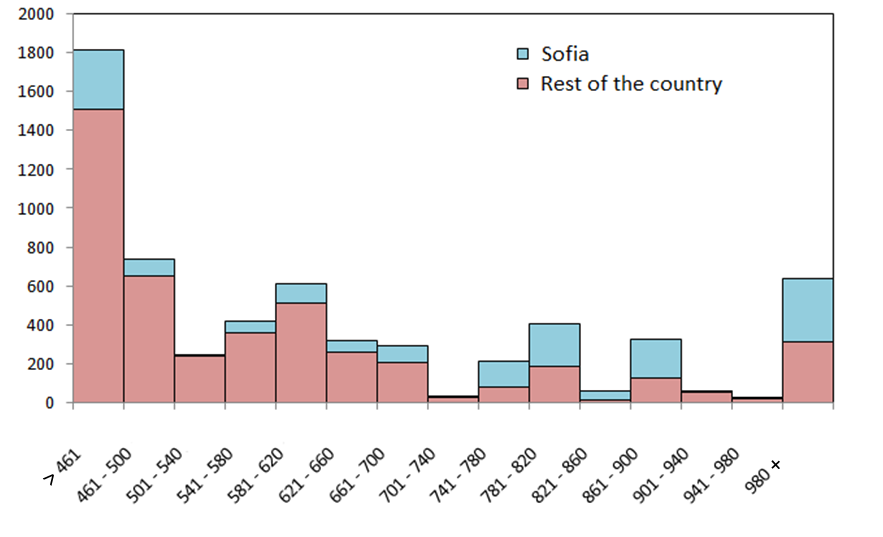
Source: EA, IME calculations
IMPORTANT : All calculations in this material take into account only job posts that contain information about the proposed remuneration and workday duration. This implies some conditionality in the interpretation of data for regions where, for various reasons, labor offices/agencies do not collect/publish comprehensive vacancy information. As of November 9, 2017, 56% of job posts containing 52% of all vacancies did not contain information regarding the offered payorworkday duration. Although there has been some improvement over previous periods (when this share was close to 70%), the lack of this information hampers not only the analysis but also the process of job mediation – linking job seekers with employers.
Vacancies and the minimum wage
Once again, the review of EA data shows the high relative share of vacancies in the country, which offer a minimum wage (29.3%) . If we set the threshold not at BGN 460, but rather and at the expected level from 1 January 2018 (BGN 510), this share jumps to as much as 42%. Simply put, this is the share of job vacancies in labor offices that can be affected by the planned lifting of the minimum wage.
Of the 90 municipalities for which there are comprehensive vacancy data available, there are 7 where the average wage offered is equal to the minimum wage (Veliki Preslav, Gotse Delchev, Kubrat, Pavlikeni, Ruen, Krumovgrad and Kula) and in another 17 it is below the expected level of the minimum wage as of January 1, 2018 (BGN 510).
In many of the poorer areas of the country, there is also an extremely low share of jobs for which both pay and working time are declared. It will not be surprising if it turns out that many of the "hidden" conditions for starting work are hidden for good reasons (such as lower than minimum wage or unwillingness to disclose the actual one). Given that only two months later, 42% of currently available jobs will have to be adjusted to the new minimum wage, these problems may get worse.
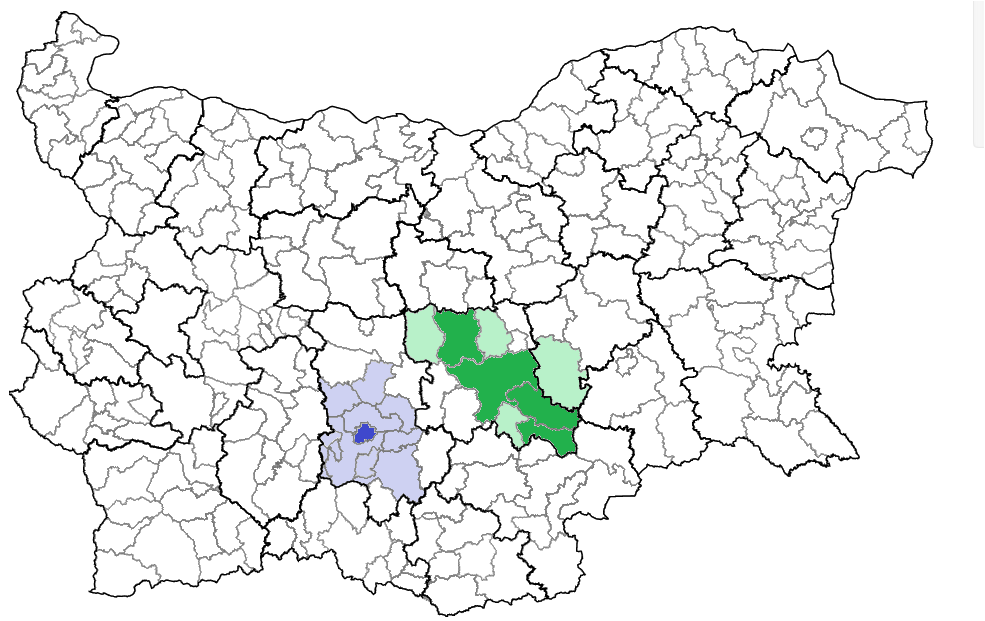
Share of job vacancies which contain information about the offered payment (%)
Source: EA, IME calculations