The Regional Differences in Bulgaria and the EU in the Last Decade
The latest Eurostat data show that the differences between the richest and the poorest regions remain significant.
Yavor Aleksiev
Recent Eurostat data show that the gap between the poorest and richest regions in EU countries is still considerable. In the 2007-2016 period, this gap increased in 12 countries, including Bulgaria, and declined in 9. In almost all cases "convergence" was achieved because the poorest regions have caught up, but because of a decline in the relative wealth of the richest one. The indicator used by European statistics for this comparison is GDP per capita, expressed in terms of purchasing power standard (PPS).
Figure 1 shows the differences in the development of the richest and poorest regions in each member state (as % of the EU average), which has more than one such region within Europe.
Figure 1: Per capita GDP (PPS) as % of EU average, 2016
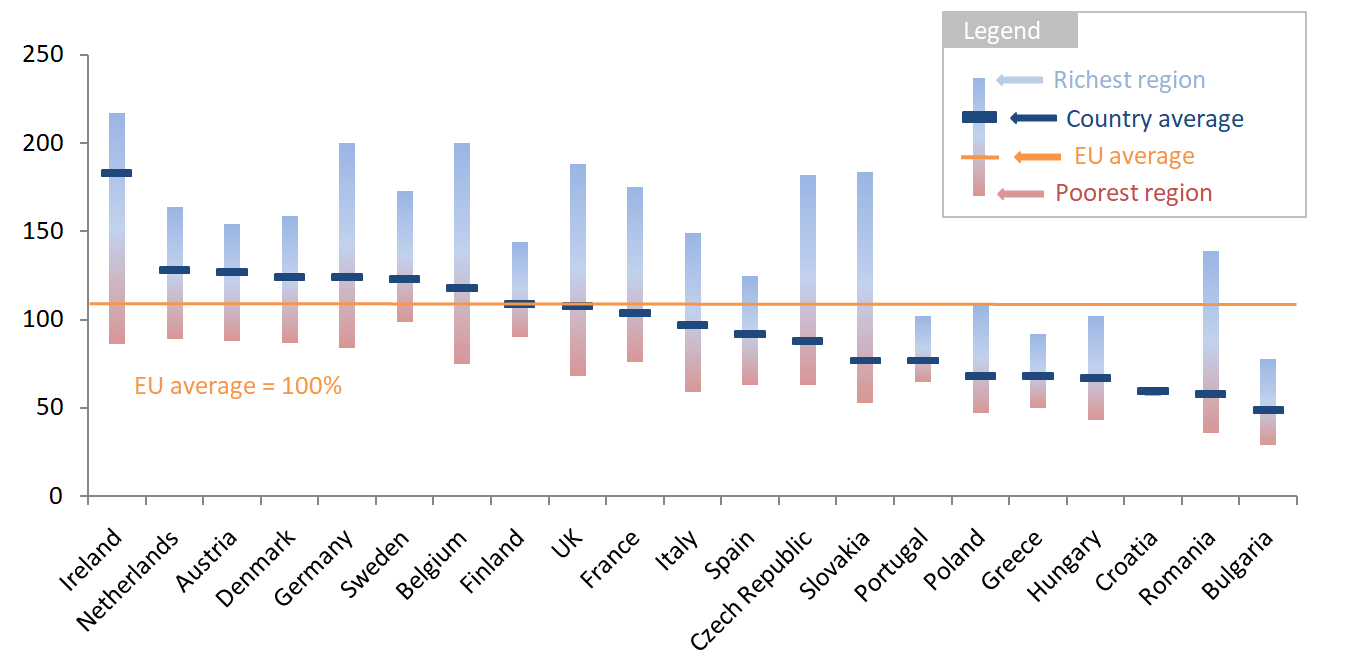
Source: Eurostat, IME calculations (* Data for the richest region in the UK show the average for all five London regions.)
It is clear that Bulgaria is far from being among the countries with the greatest unevenness in the development of the regions. At the same time, Bulgaria, Croatia and Greece, which has seriously deteriorated in recent years, are the only countries in which the richest region has lower welfare than the EU average.
Change over the last decade
The analysis of the wealth gap in the richest and poorest regions in European countries over the last decade shows that the countries in which disparities decrease between 2007 and 2016 are nine, and we can conditionally divide them into three groups :
- Countries in which differences are shrinking because of declining relative development in the richest region and increasing development in the poorest (Austria , Germany and Portugal);
- Countries in which differences are declining, but there is a decline in the relative development in both the richest and the poorest regions (Belgium, Finland, Spain, the UK and Greece);
- The only country that has managed to achieve some, albeit minimal, upward development of its poorest and richest region, that has lead to more cohesion, is Hungary.
In the vast majority of Member States, the gap between the poorest and the richest regions is widening. We can define four groups here:
- Countries in which both the richest and the poorest regions have increased their relative development, but the differences are getting bigger due to faster growth of the rich regions - Denmark , Poland , Romania and Bulgaria;
- Countries in which both in the richest and the poorest regions are losing ground compared to average EU levels, but the negative processes are more pronounced in poor regions, so the gap is widening - the Netherlands , Sweden and Croatia;
- Countries in which the differences are growing due to an increase in the relative level of development in the richest region and a decline in the poorest - Ireland, France and Italy;
- Countries in which the poorest region stagnates and the richest improves its relative level of development - the Czech Republic and Slovakia.
Focus on Bulgaria
Between 2007 and 2016 GDP per capita, expressed in PPS, in the poorest Bulgarian region (Northwest Bulgaria) has increased only slightly - from 27% to 29% of the EU average. For the same period, the increase in Southwest Bulgaria is from 67% to 78% and the average for the country has increased from 40% to 49%. Thus, our country remains last in terms both of the relative prosperity of its poorest region and that of its national values. In 2007, the poorest Romanian region (Northeast) had the same level of development as Northwest Bulgaria. In the following period, however, the increase in this region of our northern neighbour is from 27% to 36% of the EU average compared to the 29% for Northwest Bulgaria.
Of course, some of the observed differences are a consequence of the peculiarities of the administrative divisions of EU countries, as the capitals of many of them are separate statistical regions.