Which Municipalities Absorb the Most EU-Funds
Since the accession of Bulgaria into the EU and the launch of operational programs, Bulgarian municipalities have absorbeda total of BGN 10.7 billion.
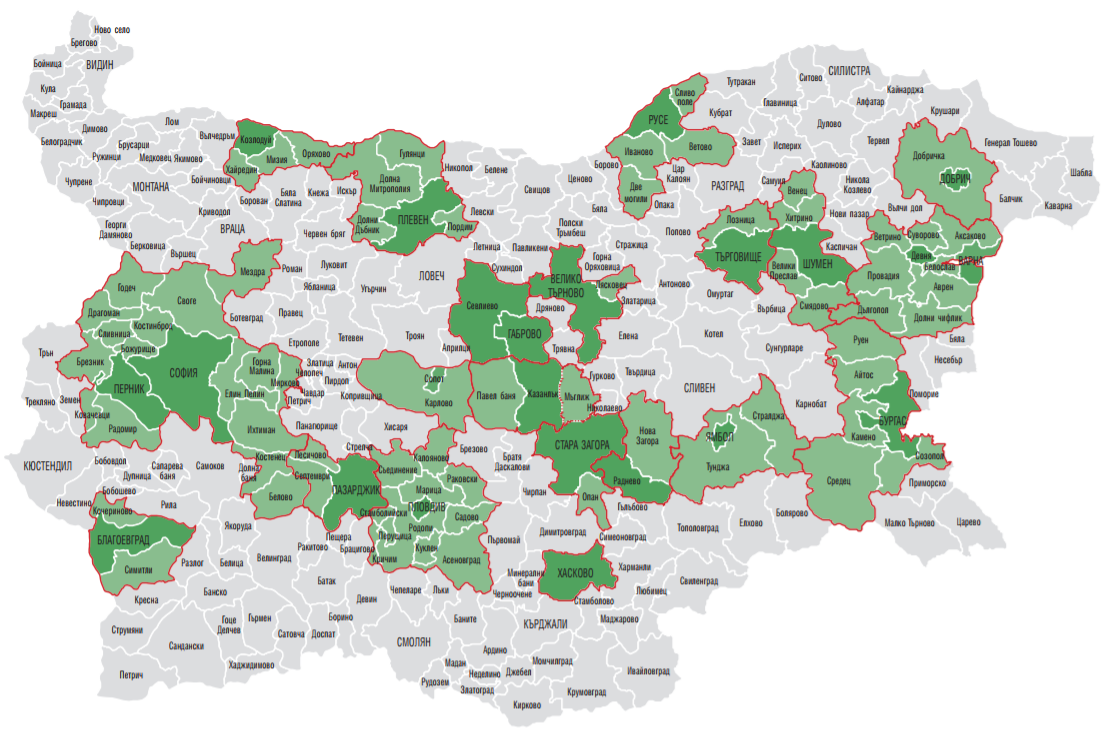
Since Bulgaria's entry into the EU and the launch of operational programs in the country, Bulgarian municipalities have absorbed a total of BGN 10.7 billion (data as of 15 June 2018). Compared to the population, municipalities received an average of BGN 1513 per person. The biggest chunk of the funds went to the municipalities of Sozopol and Kostinbrod - the only ones with more than BGN 5000 per person while the least went toKovachevtsi and Dulovo - the only ones with less than 100 leva per person. Kovachevci has no project in the new administrativeperiod (2014-2020),whileDulovohas only one.
A total of 9 of all 265 municipalities have received funds for only one project in the new administrative period, with only Dulovo having a population of over 10,000. The reason for this can be found in the limited administrative capacity in the smaller municipalities.
50 municipalities have received under BGN 2 million under the operational programs so far, while the number of municipalities with over BGN 10 million reached 103.In 16 of them the amounts actually paid are over BGN 100 million. They include almost entirely district centers, and the capitalof the country, which is a leader with a big difference, absorbing 3.6 billion leva, most of which is for metro-related projects. In regard to the population, Sofia Municipality also stands out compared to other districts by BGN 2726 per person. A little lessreceived the municipalities in Gabrovo District - BGN 2623. On average, the least funds absorbed are by the municipalities of the regions of Sliven and Kyustendilwith less than BGN 800 per person (this amount does not include the funds paid to the regional administrations - the total data by districts up toMay 1st 2018 is available HERE).
The most expensive projects are mainly for transport infrastructure (highways, roads, urban transport), water cycles and water treatment plants and projects aiming to improve the urban environment and the educational structure.
Compared to the previous administrative period (2007-2013), the smallest growth rate in the absorption of the European programs per capita is observed in the coastal municipalities of Nessebar, Sozopol and Primorsko, which, however, received relatively big amounts of money before 2014 and are currently also well-performing absorbershaving two more years until the end of the current administrative period.
The municipalities of Nevestino, Alfatar and Simeonovgrad show the highest rate offunds absorbed after 2014 while in the previous administrative period theyabsorbed very little - on average, less than BGN 5 per person.Now they reached more than BGN 300 per person, which is relatively smallerthan the country average, but this shows the activation of the local administrations and the propulsion of more projects. Some of the highest fund absorption rates are in the municipalities ofGramada and Sarnitsa, which is, however, entirely due to the fact that they have not absorbed European funds in the previous period. The municipality of Gramada is the only municipality that had no projects before 2014, and the municipality of Sarnitsa did not exist until 2015. As of June 15, 2018, the absorbed funds were about BGN 400 per person.