Local Taxes Remain Unchanged Before the Elections
2019 puts an end to a 3-year period of constant tax hikes at the local level.
2019 puts an end to a 3-year period of constant tax hikes at the local level.
The article will be available in English on July 7th, 2019.
The improving the economy has not had any positive effect on the labor market in many of the poorer municipalities, especially those in which there are persistent negative demographic trends.
After we presented two weeks ago the data for the size of the average gross wage on municipal level, our analysis of the labour market continues with a review of the dynamics of the number of employed people. Since the differences in the number of workers on municipality level are considerable and depend highly on the size of the local population, the map below shows the relative change in the number of workers in 2017 compared to 2011. This approach to the presentation of data also implies certain conditionality and because of this our analysis focuses its attention only to municipalities in which lasting trends are observed, regardless of their demographic developments.
It is important to note that the data presented on the map show the workers based on their place of work and not on their domicile. Because of this, for example, it is not surprising that in the municipalities around Plovdiv, where most of the newly founded industrial zones are situated, register a higher relative growth of employees in the local centre.
Compared to 2011, the total number of employed people in the country in 2017 has increased by 2.9%. On the municipal level the situation is the following:
The good examples
The municipality of Letnitsa in the Lovech district has experienced the highest increase in the number of employed people compared to 2011, which has also been accompanied by a significant growth in the payment of the already hired 1500 people in the same municipality. The average gross wage in the municipality has increased by 56%, reaching 1,425 leva, which is 18% more than the average for the country. One of the main factors behind the good performance of the municipality of Letnitsa is the presence of “Walltopia Ltd”, but companies from the ceramic and food industries also operate in the municipality.
In second place in terms of increase in the number of workers is the municipality of Bozhurishte (with an increase of 62% ) where the average wage of the 2500 employed people there is nearly 1,150 leva in 2017, exceeding by 10% the average levels for the country. Near the capital, apart from Bozhurishte, a considerable increase in the number of employed people (with around 1/3) has also the municipality of Botevgrad where the daily employed increase with around 500 people, reaching 12,600. This positive trend has not stopped since 2012 and is accompanied with an increase in the wages which is higher than the average for the country. Moreover, since 2017 the level of pay in the municipality is above the average for the country. In 2017 there was also an increase in the number of workers in the municipality of Mezdra (with around 1900 people), mainly because of the production of auto parts. The wages in the region, however, remain low and the unemployment level is considerably high.
The success of the “Trakia” economic zone is clearly seen on this map as well. The municipalities around Plovdiv have some of the best results in the country – in 2017 in the municipality of Rodopi the increase in the number of employed people is 48% compared to 2011, 39% in the municipality of Saedinenie, 28% in the municipality of Rakovski, 23% in the municipality of Kuklen, and 15% in the municipality of Maritsa. In each of these municipalities, with the exception of Kuklen, the level of pay is increasing quicker than the average for the country as the average wage in the municipality of Maritsa, where the most people work (if we exclude Plovdiv itself), is already 1% above the average for the country.
With over 50% is increasing the relative share of the employees in the municipalities of Aksakovo and Suvorovo (Varna region). In Aksakovo there is a lasting trend toward an increase, as the interest for investing in the region continues to be significant. In the meantime, the result from the smaller local labour market in Suvorovo can be mainly attributed to the one-time expansion in 2012, followed by a period of stagnation in the number of employed people.
The municipalities in the “red” zone
The negative demographic development of a significant part of the Bulgarian municipalities has a profound effect on their potential to reach an increase in the number of employed people on their territory. In the same time, like in the case of successful municipalities, this effect can be softened or strengthened depending on the condition of the local economy.
The highest decline in the number of employed people is observed in the municipality of Miziya, in the district of Pleven (a decline of 40%), as well as in the municipalities of Bobov dol and Trun (with 33,8%). It is important to note that in this case we are talking about a municipality which ran a referendum against the development of heavy industry, and a municipality in which companies have serious problems in the same sector which in turn leads to the closing of mines and to job cuts.
Nearly 1400 out of the 1700 total jobs in the municipality of Bobov dol disappeared during 2016 and 2017 which is related to the crisis in the coal mining sector – the closing of the “Babino” mine and the cuts in the “Fundamental” mine (later closed in 2018). The “bottom” in the labour market in the municipality of Tran was reached relatively late – in 2015, whereas the subsequent increase in the number of employed people was rather small and we could hardly talk about a real recovery. In the same time in Tran, and in other relatively small communes like the already mentioned Miziya, Georgi Damyanovo, Bregovo, Brusartsi, etc., wages are increasing faster than the average for the country, mostly because of the immediate effect from the increase in the minimum wage.
Despite this, in all these municipalities, the average gross wage remains lower than 65% of the average for the country as in most municipalities the “catching up” is only a couple of percentage points, and as we already mentioned, the employed people decline drastically.
Highly worrying is the situation in Bolyarovo (Yambol region), where the decline in the number of employees of 25% is accompanied by a relative decline in the wages – from 69% to 59% of the average. Keeping in mind the problems in the key for the municipality livestock sector in 2018 (the euthanasia of thousands of small ruminant animals), it can be expected that the situation is even worse. An even more drastic decline in wages, again accompanied by a significant decline in the number of employees, is registered in Bobov dol and Belene – from 109% to 83% from the average for the country and from 97% to 66% from the average for the country, respectfully.
The data for the levels of the gross wages and for the number of employees on the municipal level show that the recovery of the labour market and the subsequent expansion are going on unevenly on the territory of the country. The improvement of the overall economic conjuncture does not seem to have a strong positive effect on the labour market in the very poor municipalities, especially in those in which strongly negative demographic processes are observed. Despite the fact that most of the increases in the number of employed people comes from the South, some of the best performing local labour markets are in the North. As is clear from the map, however, we can hardly talk about a homogenous development in the North-West and the North-Central regions. The impression of a presence of separate “islands” of economic activity is confirmed from these data.
Which is the municipality with the highest wages in Bulgaria?
Petar Ganev
Which is the municipality with the highest average wage in the country? This question does not have a straight answer. The reason behind this is that the data in the country for the employees and the wages on the municipal level are not published, but must be requested from the National Statistical Institute (NSI). On the regional level, the information is often related only to the wages on the district level, which does not tell us much – it pools together the big regional centre with the small village commune, and those are clearly very different. The discourse about regional inequalities is more precise when we have in mind the municipality level.
Exactly because of this, after we published the municipal map of unemployment rates for the 2011-2017 period, today we also publish an interactive map with the municipal wages for 2017. It is important to note that the data for the municipal level wages for 2018 are still not available. However, from the country-level data we already know that the average wages in 2018 have already grown 10% compared to those in 2017. This means that when you look at the municipality wages on the interactive map, you must keep in mind that the average wage in the given municipality is most probably rising – the mark is a rise of around 10%. It is clear that the rates of increase will be different for each municipality, but, in general, we should expect a rise in all averages – the comparison between 2017 and 2016 confirms this.
The municipalities with the highest average wage in Bulgaria are not the big district centres. The leaders are, in fact, fairly small municipalities, in which there are large employers – usually in the energy and manufacturing sectors. These big companies pay high wages and also dominate the local labour market – in other words, a big part of the workforce on the territory of the municipality works exactly for them. This is very clearly expressed in the municipality of Mirkovo, since it remains the only municipality for which we do not have available data for the average wage - the data is confidential.
The highest average wage in Bulgaria for 2017 is registered in the municipality of Chelopech – here there is a big mining company which leads to an average wage of 2,178 leva for the municipality. After the municipality of Chelopech we have the municipality of Kozloduy with its nuclear power plant – with an average wage of 1,790 leva; the municipalities of Radnevo and Galabovo, with their big companies in the energy sector, have average wages of 1,657 and 1,610 leva, respectively. After them, we have the municipality of Pirdop – an average wage of 1,562 leva (again, thanks to a big mining company) and the municipality of Devnya – an average wage of 1,442 leva (with its developed manufacturing sector).
The capital Sofia is placed 8th in 2017 with an average wage of 1,433 leva. Despite leading many other economic rankings, here the municipality of Sofia cannot take the top spot since the economic profile of the capital is highly diverse and, although wages are high, they cannot reach the average levels of pay in some of the small municipalities where a considerable share of the workers are hired in the energy or manufacturing sectors. After Sofia in the ranking comes Panagyurishte (9th place) with an average wage of 1,285 leva in 2017. Again, this is an example of a municipality which reaches the top positions thanks to its big mining company. The other municipalities in the top 20 include municipalities with a heavy manufacturing sector – usually near a big city, with well-developed industrial zones. Examples of such municipalities include Kostinbrod, Elin Pelin and Bozhurishte (near Sofia), Suvorovo, Aksakovo and Beloslav (near Varna), and Maritza (near Plovdiv). All these municipalities had an average wage between 1,000 and 1,200 leva in 2017.
A look at the municipal level map of wages allows us to see clearly the leading economic centres, as well as the regions which experience difficulties. The differences between North and South Bulgaria can also be seen clearly. In the South centres with higher wages are formed around Sofia and Plovdiv, as well as around Burgas and Stara Zagora. Centres which are well connected and can truly interact in a positive way. To these big cities we can add also the mining sector in the small communes in the Srednogorie Region.
In the North the only centre with high wages around a big city is Varna. The other examples, like Sevlievo and Letnitsa, are good but they cannot have a considerable influence on this part of the map. This is one of the arguments which we have mentioned previously when we talk about regional development. The problems of the North are not related only to the depopulation of certain municipalities in North-West Bulgaria, but also to the absence of strong economic centres, which can interact. Some of the big cities in the North, like Pleven, are actually losing workers and they do not offer high wages.
In fact, if we take a closer look at the map, we can also see big clusters of municipalities with low wages in the South, especially around Blagoevgrad. A year ago, there was a discussion about why the wages in Blagoevgrad are so low and comparable to those in Vidin. The municipal map can give us a reasonable answer. In the municipality of Blagoevgrad, the wages are not so low, but the situation in the nearby small municipalities has seriously deteriorated. Less than 1/3 of the workers in the Blagoevgrad area work in the local centre. The rest of them work in nearby municipalities where the wages are some of the lowest in the country.
This map is an excellent example of how the availability and the clear presentation of municipal level data can explain the many processes on a regional level. In this case, IME made a modest investment in order to make this data available to all.
With the approach of the next population census in 2021, the issue of changing the number of municipalities will become more and more relevant.
With the new census in 2012 fast approaching, the issue of trimming down the number of municipalities will become more and more important. The six maps below show some (but far from all) reasons causing the need to consolidate the local government units in some parts of the country.
Municipal workers per capita
The continued decline of the population in some regions of the country results in more wild ratios between the size of municipal administrations and the size of the population that they provide services to. This can be seen clearly in the map below, based on the quarterly data from the Ministry of Finance data on the financial condition of municipalities, including the number of municipal workers in the third quarter of 2018.
Ministry of Finance data show, that the municipalities with the smallest number of municipal workers relative to the population are Sofia municipality, Kazanlak, Dobrich and Pernik. Each of them have about 500 people per municipal worker.
Similar conditions are also present in most larger cities, excluding Pleven, which has 247 people per municipal worker.
Smaller municipalities, however, are quite different, and in some places there is a very low ratio of municipal workers to population. Treklyano municipality in Kyustendil region is a very clear example of that trend, with 26 people for each municipal worker. In total, 41 municipalities have fewer than 100 people per municipal worker.
These data show, that, even though a territorial and administrative reform is out of the public discourse at present, it is unavoidable in the near future, especially should the current obligations of municipalities be kept as is or be expanded. There are municipalities where local administration is among the largest employers – a trend, which, paired together with the issue of effectiveness of public spending raises numerous concerns regarding political process at the local level.
Municipalities under 6 thousand people
The unbalanced ratio between municipal workers and local population is mostly a consequence of the lower part of the equation - the number of people, living in a given municipality. The reason for this is that the municipal administration has to carry out a basic number of functions and provide services, regardless of its size.
The next map shows the municipalities, which according to 2017 data do not meet the first criterion of Art. 8 of the Law on the administrative and territorial division of Republic of Bulgaria (LATDRB) for the creation of a new municipality – having a population over 6 thousand people.
According to NSI data, their number has doubled between 2000 and 2017, and in the last year a quarter of all municipalities (a total of 72) do not meet this legal criterion.
Most of those municipalities are in border regions, with a particular concentration observed in Northwestern Bulgaria. There are also 15 municipalities where the population is over 6 thousand, but below 7 thousand people. Most of those 15 are also characterized with a pretty pronounced population decline, even though there are some exceptions, such as Gorna Malina.
The question why the requirements for creating a new municipality do not apply for already existing ones stays on the table due to significant problem stemming from it, such as:
The continued denial of territorial and administrative reform in spite of demographic logic leads to an inability to conduct local policy (including via the completion of EU projects), due to the lack of administrative capacity and sufficient financial resources in municipalities.
A good example of this is Kovachevtsi, one of the smallest municipalities in the country, with only 1658 inhabitants in 2017. It is also the only one which as of June 15th 2018 does not have a sigle euro absorbed under any EU fund. Nine other municipalities have only one completed project in this programme period (2014-2020). Seven of those are in the group of municipalities with less than 6 thousand inhabitants: Treklyano (798 inhabitants), Tsenovo (5049 inhabitants), Borino (3157 inhabitants), Chavdar (1174 inhabitants), Chelopech (1545 inhabitants), Madjarovo (1716 inhabitants) and Hitrino (6662 inhabitants). The eight municipality is Opaka (6084 inhabitants), the ninth – Dulovo (27506 inhabitants).
Since Bulgaria ascended to the EU and the cohesion programs started in the country, Bulgarian municipalities have used a total go 10.7 billion leva (data as of June 15th 2018). Relative to their population, municipalities have received on average 1513 leva per capital. Most money have been spent in Sozopol and Kostinbrod – the only municipalities with over 5 thousand leva per capita.
Bulgarian language and literature matriculation exam results
Purely demographic challenges and their effects on the capacity of the administration aside, small municipalities are also faced with significant problems in the field of education. The differences in the quality of education has become evident in the past few years, after the introduction of measures aiming at improving control at matriculation exams. While some larger municipalities keep achieving similar results as before, in some parts of the country the drop in average grades and the growth in the share of failed students at the examination are significant.
In 2018 only five municipalities had an average mark below 3.00, compared to 8 such municipalities a year ago. Even though there is not a single municipality with an average mark above 5.00, this year a grand total of 90 are above 4.00, and 15 are above 4.50 (out of a total of 237 municipalities where matriculation exams took place; the rest do not have a single school with at least one student taking the exam).
In 2018 the data demonstrate that the results are a function of the size of the municipality, as larger schools in larger municipalities in general achieve better results. Some smaller municipalities where very few students take the exam can sometimes achieve much better averages, but their results are also much more volatile over the years. On the other hand, large municipalities – Sofia-capital, Plovdiv, Varna Burgas, where the leading schools in the country are located, are always among the top ranked on the basis of average grades.
Unemployment
The bad demographic conditions in many municipalities and the inability of local authorities to influence the socio-economic processes also influence labour markets.
In 2017 there are compact clusters of municipalities, where the overall improvement of the economic conditions in the country have not “cough on” yet, especially when it comes to the labour market. Some of the reasons for this are the low business activity in those municipalities as well as the surrounding ones, as well as the relative low labour mobility of the population in those regions, including as a result of low qualifications and education of the population of working age.
In 2017, one can travel the 206 kilometres from Makresh municipality (Vidin region), though Valchedram (Montana region) to Yablanitsa (Lovech region), without crossing into a municipality with unemployment below 25%. Clusters of municipalities with high unemployment can also be found in the mixed ethnicity regions in the Northeastetn part of the country (Samuil-Venets-Hitrino-Kaolinovo-Nikola Kozlevo, for instance).
Coverage of the cadastre
The last map in this article shows the coverage of the territory of each municipality, included in cadastral maps as of the end of 2017.
The cadastre is an important prerequisite for attracting investment, optimizing land tax collection, the completion of infrastructure projects and reduction of property theft and legal battles. Low cadastre coverage of the territory of a municipality is an obstruction to investment, especially when such investment includes new construction.
In spite of the expansion of the territory covered in the past years (from 18% in 2013 to 36.6% in 2017), the improvements mainly cover larger municipalities. In 2017, in 37 of the 72 municipalities with less than 6 thousand inhabitants, the cadastral coverage is less than 1%.
NSI published the regional GDP data for 2017.
Last week, the National statistics institute published the data on the regional gross domestic product (GDP) for 2017. These data allow us to map economic processes on the regional level, even though with a one-year lag. Traditionally, news on regional GDP focus on the differences between the regions. As usual, in 2017 Sofia is far ahead of the pack in terms of GDP per capita with 30 295 leva, and Silistra ranks last with only 6 687 leva. The details on the industry structure of the regions, however, are often left behind. In this article we focus on precisely this, though the gross value added (GVA) of the different industries on the regional level.
The overall structure of the country’s economy is pretty clear – services form 67% of it, industry – 28%, and agriculture is only 5%, and this distribution has been pretty stable. In the past five years (2013-2017) industry has gained only one percentage point, resulting from small decreases both in the shares of services and agriculture. What are, however, the distinct profiles of the separate regions, and which are the industry and agricultural regions in Bulgaria? In order to answer this question, we the shares of the primary industries in gross value added on the regional level. Separately, we shall review the value added by industry per capita in the regions, in order to assess whether the separate economic sectors are creating real value, or they just have higher shares as a result of the weak development of the other spheres of economic activity. It is important to note that the data are weighed relative to the population of the regions, as otherwise larger regions will always have a significant lead.
Industrial regions – Stara Zagora, Sofa (district), Vratsa and Gabrovo
Data on the regions where industry is prevalent are absolutely clear. The four regions are the only ones where industry creates at least half of the gross value added – 66% in Stara Zagora, 61% in Sofia (district) and about 50% in Vratsa and Gabrovo. It is interesting that in all of those regions industry has increased its share in value added, by 5-6 percentage points in the past five years. Should we look at not only the share, but the nominal value added by industry per capita, those very same regions take the top four spots, and in the same order – 9985 leva per capital in Stara Zagora, 8177 leva in Sofia (region), 5305 leva in Gabrovo and 5300 in Vratsa.
The reason behind this industry focus of those regions is no surprise either. They all have major industrial companies - the large electrical producers of Radnevo and Galabovo in Stara Zagora, Kozlodui NPP in Vratsa, as well as some larger mining companies in the Srednogorie (Pirdop and Chelopech, for instance) in Sofia (district). Gabrovo is the only example of an industrial region that lacks a major energy or mining company, the regional centre has a longstanding industrial traditions (and is known as the “Bulgarian Manchester” for a reason), and the large factories in Sevlievo are also in the region.
Services regions – Sofia (capital), Varna and Burgas
Defining the regions with a pronounced services profile is not such a simple task. Only the capital city of Sofia is obvious, as services have a significantly higher value added (22 575 leva per capita) and a grand total of 86% of the gross value added in the region. Varna is second, but the share of services is 69%, the nominal value of GVA – 8320 leva per capita. Burgas is also at the top of the list, but far behind the others – the share of services is 64% (still high, but close to that of Pleven and Veliko Tarnovo), but the gross value added per capita is 6790 leva, which puts it far ahead of the rest of the regions, excluding Varna and the capital city.
Services-focused regions actually also contain the largest regional centres in the country – only Plovdiv is missing, but we will cover its case separately. The economies of Sofia and those of Varna and Burgas are, however, very different. More than 10% of all employees in Sofia are in ICTs (as of 2017), and this is the high-tech part of the service sector, which pushes wages higher. In Varna and Burgas this sector is not as widespread, and only 1-2% of all employees work in ICTs. In the same time, tourism plays a very important role in the economies of the two regions, as 14% of the employees in Burgas and 9% in Varna work in hotels and restaurants, while the share of this sectors of services is only 4% in Sofia as of 2017. In other words, while the service economy of Sofia is more focused on high tech, Varna and Burgas still haver more pronounced traditional sectors.
More agrarian regions – many and getting poorer
Finding the agricultural regions is likely the hardest task, because they are more and relatively poor. The poor development of the other sectors sometimes makes the share of agriculture seem as if it is of importance for the regional economy. In spite of this, the following regions have the highest shares of agriculture relative to the other parts of the country - Silistra (23%), Vidin (18%), Montana (16%), Razgrad (16%), Dobrich (16%), Kardzhali (15%), Targovishte (14%), Shumen (13%) and Yambol (13%).In these regions, the gross value added per capita of agriculture is also the highest, about 1000 – 1300 leva.
It is evident that the regions where agriculture generates more than 10% of gross value added are also at the lower end of the spectrum in terms of wealth, and are among the lowest in GDP per capita. The reason behind this is that the value added in agriculture remains quite low – even in the region where GVA per capita in agriculture is the highest (Silistra, 1327 leva per capita), it is still three times lower compared to the country average for industry (3522 leva) and sic times lower than the country average for services (8281 leva). Silistra and Vidin are also the only regions where value added per capita in the industry is so low, that it is lower than agriculture in those particular regions.
What are the dynamics and where is Plovdiv?
The common regional dynamics in the past 5 years shows that the increases in the share of industry in value added are in the regions with the most pronounced industrial focus. The regions dominated by services, with the exception of the capital, also show some increases in the share of industry, mostly in Burgas and less so in Varna, but in those regions services create more value added in general. In the relatively agricultural regions, with the exception of northwestern Vidin and Montana, the share of agriculture is dropping. The case of Vratsa, where there is a giant leap in industry at the expense of both services and agriculture, is quite curious. This is a consequence of the good financial results of NPP Kozlodui – 100 million leva more income in 2017.
The exclusion of Plovdiv from the regions with well-defined profiles is a consequence of the diversity of the region’s economy, with combines powerful industry and services, which, as we have seen, are inevitably in the lead in the regions with the largest cities. Based on the value added of industry and services Plovdiv sits right behind the abovementioned regions in both categories – 5946 leva per capita in services and 4 143 leva per capita in industry. After a more defined growth of services in the past few years, the ratio in Plovdiv has settled at 56-57% services and 40% industry in the overall value added. Similar developments can be seen in Ruse, which ranks close to Plovdiv in terms of value added per capita in industry and services, and has a pretty similar sectoral structure.
The IME has published the Bulgarian edition of Regional Profiles: Indicators of Development (2018)
 For the seventh year in a row, the Institute for Market Economics presents the study “Regional profiles: Indicators for Development” – the only comprehensive yearbook on Bulgarian regional development. The Regional profiles, as the study is better known, has become an indisputable trademark of the IME.
|IN BULGARIAN download the complete study or see the profiles of the separate regions |
Thanks to the work of the institutions gathering and providing statistical data, every year the study includes more recent and more comprehensive information on the economic and social conditions in the country’s regions. The majority of data included in the current editions are for 2017. There are a few exceptions for data that are published with a delay longer than a year – regional data for GDP per capita and wages, as well as some indicators concerning investment, the environment, infrastructure and education. The analysis also includes some data for 2018 (in the field of administration, local taxation and matriculation exam results) where such were available in the middle of 2018.
This publication can be used both by the central and local authorities, businesses and the media, as well as educations, experts and representatives of the non-governmental sectors who deal with regional development. We believe that it would be interesting for everyone to check how his region is doing compared to others in the separate fields of economic and social life.
In 2016-2017 Bulgaria’s economy has increased its growth to about 4% annually, as all regions showed increases in the standard of living and economic wellbeing as measured by gross domestic product per capita, wages of the employed and household income. While in the previous years of the economic recovery following the 2009 recession the positive processes took place only in parts of the country, in the past two years economic developments has taken over the territory of the entire country.
Some regions, however, do have visibly faster growth rate sin all of the aforementioned indicators, mostly as a result of booming local economies and catch-up growth of wages and income. Such a local “economic tiger” in the last edition of our study in Plovdiv region, which has a 10% growth of GDP per capita and 9% growth in wages in 2016 alone. Given that incomes in the region grew by 16% in 2017, it is highly likely that that year was also very good for the local economy. Other regions with relatively high GDP per capita growth in 2016 were the strong economic centres of Burgas and Stara Zagora, as well as the smaller, but quickly catching up economies of Pernik, Lovech, Targovishte, Razgrad and Gabrovo.
The growth of household income and spending led to improvements in almost all regions in the primary absolute poverty indicator – the share of people living in material deprivation.
Good economic growth also went hand in hand with improvements in the labour market in most regions. Even more – 2017 had record employment rates in the economically active population (ages between 15 and 64) in most regions. Employment is about 70% for that cohort on average in Bulgaria, and well above 70% for the strongest economic centres, like Sofia, Plovdiv and Stara Zagora.In most regions unemployment is also approaching the record lows of 2008, but there still remain regions where the coefficient is in the double digits – evidence of serious structural problems of local labour markets, low population mobility and even statistical inadequacies of regional data. Almost all regions with unemployed rates above 10% (in the 10-64 age group) are located in North Bulgaria – Vidin, Vratsa, Pleven, Silistra, Targovishte, Shumen. The only ones in the South are Sliven and Smolyan.
The region’s abilities to attract local and foreign investment is a key driver of good economic development. Once more, the regions with growing foreign investment stocks per capita in 2016 are among the strongest economic centres – Sofia-capital and the wider Sofia region, Plovdiv, Burgas, Gabrovo, Ruse, as well as the lesser-developed Targovishte, where investments are bringing rapid growth of employment.
Unfortunately, developments in infrastructure, and particularly road infrastructure are not as positive. Despite the continued construction of new lots of highways currently under construction, the share of highways and first-class roads remains virtually unchanged. In the same time, the share of roads with good quality pavement has dropped in 2017 and is not below 40% of all roads, which points to problems in maintenance of the existing road system.
In 2017 the demographic conditions in the country continued to worsen as a result of low birth rates and migration. The regions with the fastest aging populations are the less developed ones, like Vidin, Kyustendil, Montana, Vratsa. Gabrovo is also among them; despite the fact that the region has one of the best rates of economic development in the past years, the age dependency ratio hits record lows every year, both for the region and in the country as a whole. In 2017, only six regions attracted more people than they lost – the capital, Plovdiv, Burgas, Varna, Pernik and Kardzali.
Education indicators continue to improve, albeit at a glacial pace. There is an increase in the school enrolment rates in the country, as well as (tiny) decrease in the number of school dropouts and class repeaters in primary and secondary education. Smolyan maintains its leading position as a result of the very high grades of local students on the matriculation exams and high rates of retention of students and teachers in the system of education. Sofia, Gabrovo, VelikoTarnovo, Varna and Blagoevgrad are among the regions scoring well in this category, while Sliven, Pazardzik, Yambol and Dobrich form the bottom of the ranking. The education system is performing poorly in the least developed regions in economic terms, and this is leading to a worsening structural unemployment and thus obstructing the development of the local labour market, the attraction of investment and the improvement of the population’s income.
The quality of healthcare on the local level is also important for human capital. Traditionally, Sofia and Pleven top this ranking. As a whole, in 2017 the provision of healthcare staff relative to the population remains constant in the country, but in some regions, such as Kardzali, Sliven, Targovishte, Silistra and Razgrad the shortage of medical personnel is significant. In the 207 there was also a decrease in the number of beds in multiprofile hospitals in the country. The limited relative number of doctors and beds in local hospitals forces the citizens of a number of regions to seek medical aid outside of their region. Such regions with significantly smaller numbers of patients are Dobrich, VelikoTarnovo, Pernik, Shumen and Yambol.
Good social environment also requires a high degree of security and an effective justice system at the local level. The workload of the police and regional courts of the larger and more developed regions however leave them in the last place in the raking, while in the smaller and less developed regions registered crimes are relatively few, and justice relatively swift.
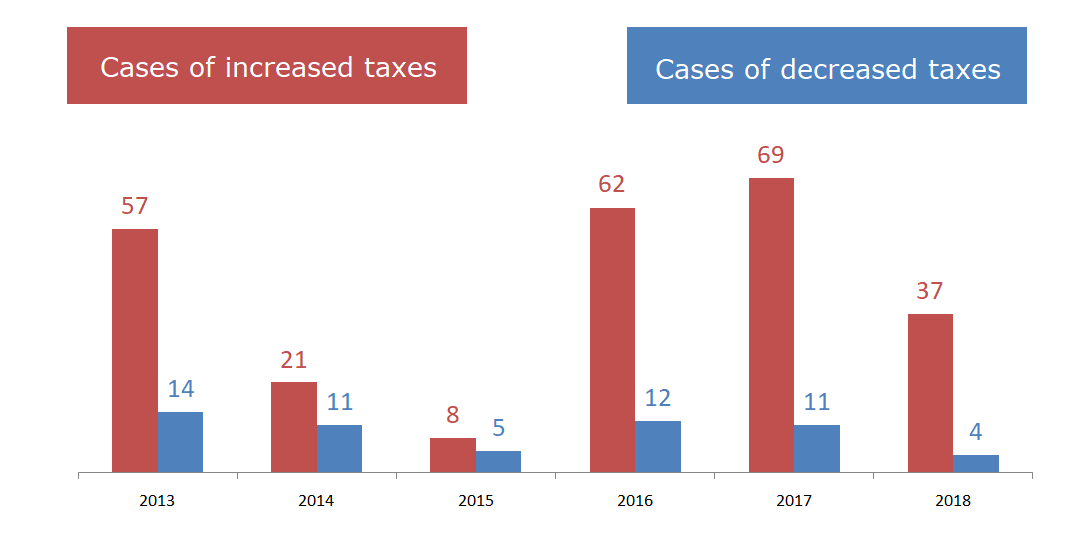
The trend of rising local taxes continued in 2018.
The trend of rising local taxes, established in recent years, continues also in 2018. The Bulgarian municipalities are increasing key local taxes in order to secure the funds they need, but in some cases to also fulfill their commitments to the Ministry of Finance resulting from interest-free loans received in recent years. This development is not surprising given the stalled process of fiscal decentralization, though higher local taxes cannot address the structural problems of the municipal budgets.
What the data shows
Between 2012 and 2018, IME conducted 7 separate annual surveys on local tax levels as part of the Regional Profiles: Indicators for Development initiative. The data was collected through applications under the Access to Public Information Act (APIA) to all municipalities in the country, as well as online tax rate checking. We looked at four of the key local taxes:
The results obtained are unequivocal: the number of increasesin the observed local taxes issignificantly higher than the number of reductionsin the local taxes, the trend being particularly noticeable in 2016 and 2017, just after the entry into force of the so-called „Rehabilitation of municipalities mechanism”.
We see that:
Why increasing local taxes will not help
According to the latest comparable Eurostat data, local governments’ revenues in Bulgaria amounted to only 7.3% of GDP in 2017, which is more than two times lower than the EU average of 15.4%. Although raising the level or collection of key local taxes may lead to some improvement in the state of municipal budgets, the problems with their structure remain.
The simplest and most easily applicable method for changing this status quo is to remit some of the proceeds from the personal income tax to the municipalities based on the principle "money follows the ID card". Assigning one-fifth of the revenues coming from income tax on natural persons projected for 2018 will increase municipal revenues by nearly 675 million leva (i.e. nearly a third) and will create real incentives for local authorities to work to attract investment and opening new jobs. The necessary steps to achieve a real change in the structure of the municipal budgets were discussed by IME in the study "The Road towards Fiscal Decentralization", published in April 2018, where an estimate of potential revenues to be received by each municipality upon adoption of this step was also provided.
The road towards fiscal decentralization
The transfer of part of the revenues from the income tax for individuals to the municipalities cannot and must not be an isolatedand unconditional change on its ownin the structure of the tax system. In order to ensure its success, further steps need to be taken, including:
Sharing the proceeds from the income tax for individuals with municipalities, and eventually assigning authorities to determine this tax within a given range, will result in:
The province is not a problem of the capital — it is a problem of politics 03.04.2026
In 2025, 159 Bulgarian municipalities (60% of all) implemented exactly 400 projects included in the...
All municipal projects can start this year – here's how 04.03.2026
Is it possible for all municipal projects in the state budget – worth a total of over 4 billion euros –...
Regional inequalities are growing 02.03.2026
Deep regional inequality remains one of the most persistent challenges to Bulgaria's economic development....
Sofia for another year breaks away from other regions in economic development 16.02.2026
In 2024, Sofia continues to stand out more and more clearly in its economic development from the other...

