The Boom of the Industrial Zones
With local elections approaching, there has been increasing talk of the formation of industrial zones in different regions of the country. The mayor of Sofia announced that she is planning to build four new industrial zones, the largest in the northern regions of the capital - Kremikovtzi, Novi Iskar and Vrubnitsa.
With local elections approaching, there has been increasing talk of the formation of industrial zones in different regions of the country. The mayor of Sofia announced that she is planning to build four new industrial zones, the largest in the northern regions of the capital - Kremikovtzi, Novi Iskar and Vrubnitsa. Simultaneously, the mayor of Sliven presented a project for what is to be ‘the biggest industrial zone in Bulgaria’ situated between Sliven and Yambol. On his side, Deputy Prime Minister Tomislav Donchev spoke of the need of 7 to 10 new industrial zones in the country and said that there is great potential for a zone be established between Gabrovo and Sevlievo. Even though these news’ appearance right before local elections is hardly a coincidence, they are undoubtedly grounded on long-term economic processes in the country.
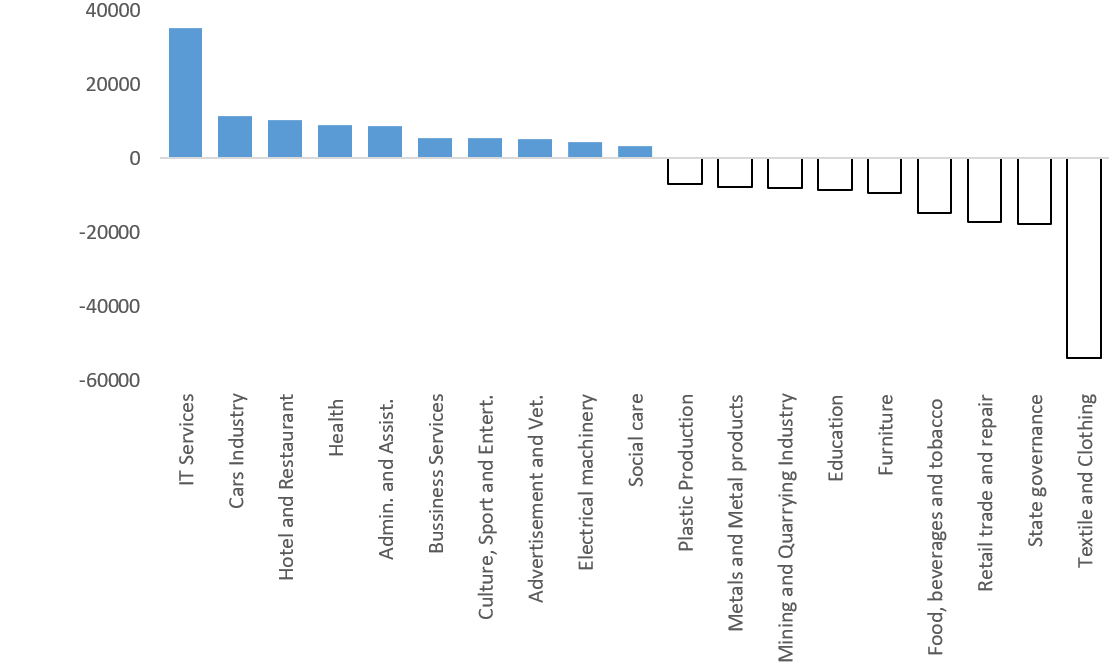
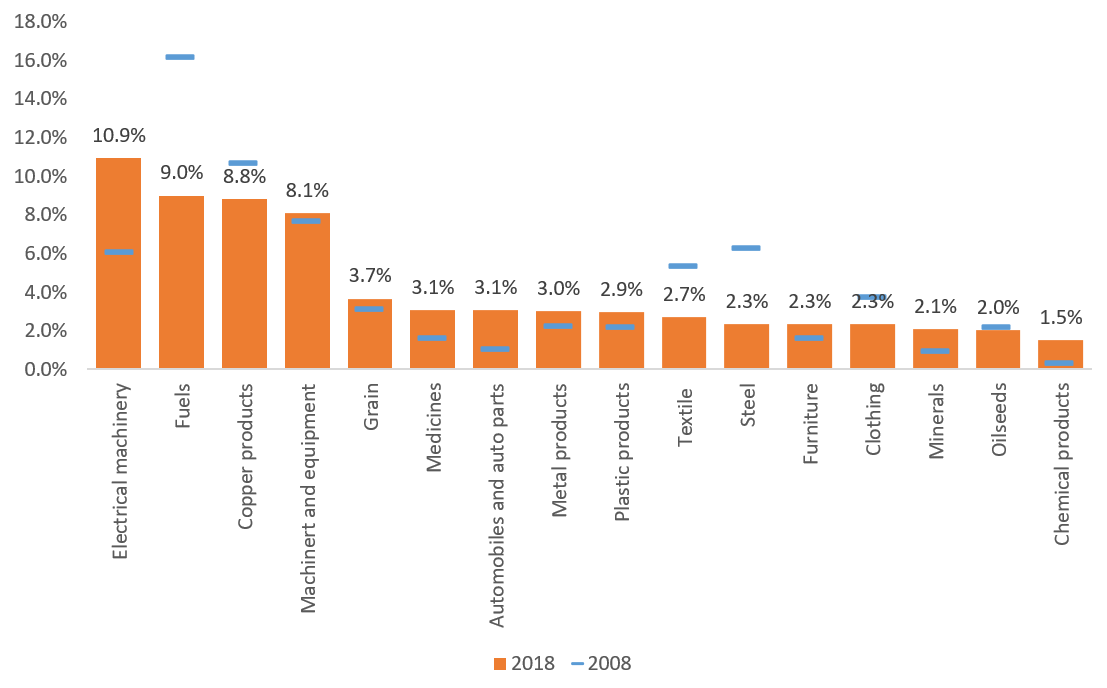
The leading factor is the shift in the Bulgarian industry which took place over the past 10 years. After the financial crisis the once traditional sectors of Bulgarian manufacturing, such as clothing production, have been losing their share – both in terms of exports and in terms of the number of employed – to the benefit of higher value added production – e.g. electrical appliances, automobile parts, machines and equipment. These processes are clear indicators of the need for the establishment and development of new industrial zones capable of accommodating the novel production.
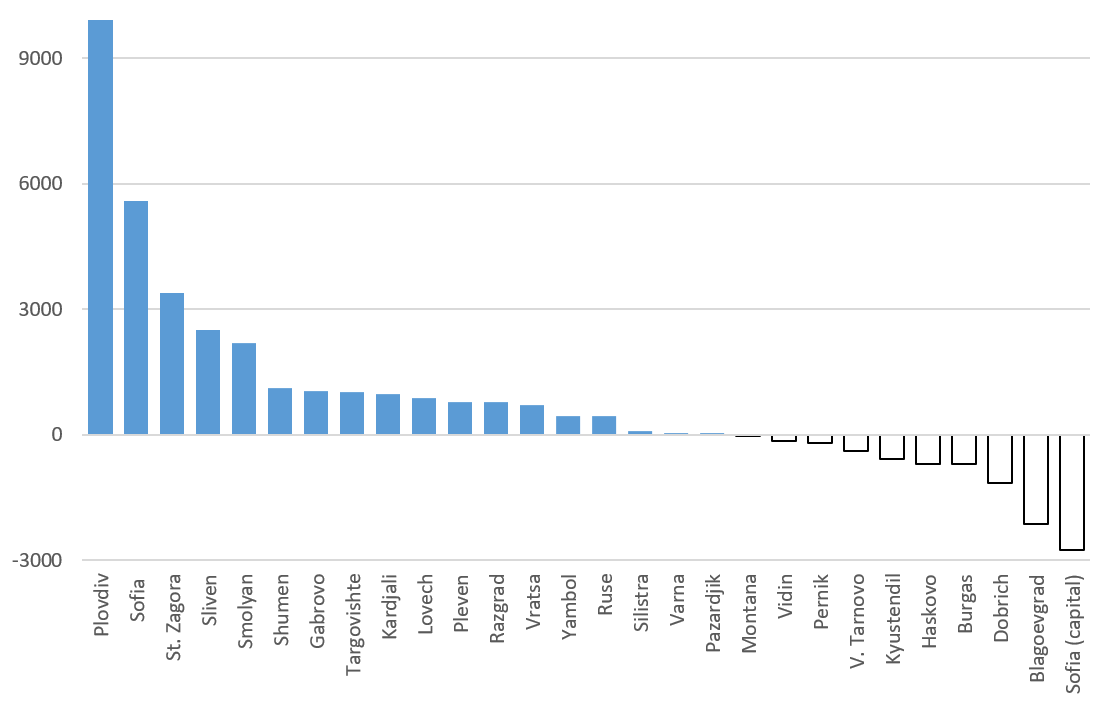
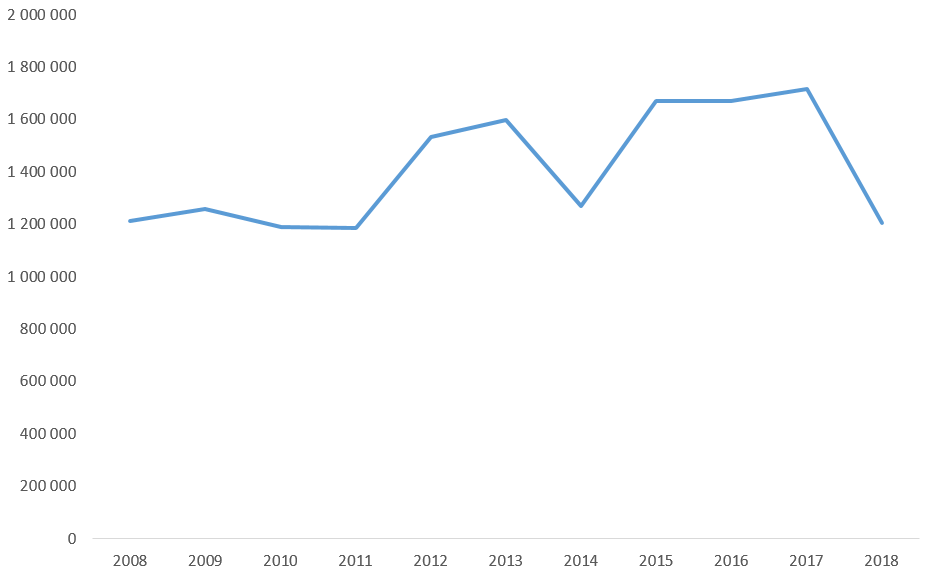
Another important factor is the unequivocal success of the prime investment regions in the country – Sofia and Plovdiv. The bottom of the number of employed in manufacturing was hit in 2013 when these were around 490 000 people. By 2017 that number has grown by about 32 000 workers but this rise is not equally driven by the different regions. The most significant increase in manufacturing laborers has been concentrated in the two leading centers – with 9 000 more employed in the region of Plovdiv and more than 6 000 more in the region of Sofia and Sofia-city. Plovdiv and Sofia are the two centers that combine a big city with a wide periphery and developed industrial terrains. These are also the two regions which have been working for years over their presentation as centers for foreign investors.
While the development of zones around the capital is hardly a surprise, the change in Plovdiv provokes more interest. The collaborative work of a few municipalities and the unification of the industrial zones around Plovdiv under the Thracian Economic Zone brand is a success and has caused other big towns to pursue the foundation and promotion of their own industrial terrains. But whereas the foremost factor in Plovdiv is private initiative – in practice, the zone is managed by a private operator, - in most other regions the recent development of zones is promoted by the “Industrial Zones National Company”.
In most cases the municipality gives away the terrain on which it plans to establish the industrial zone, while the state company finances the necessary infrastructure. This is not because the municipalities cannot find alternative means to develop these zones, such as partnerships with private actors, but is rather due to the attractiveness of the easy access to finance that the National Company provides. The latter already has six operating zones, five are being developed and quite a few memorandums for cooperation have been signed with various municipalities.
If it is true that 7 to 10 more zones are to be built in the country, the majority of which will most likely be financed be the National Company, the dominance of a large state operator in the country is becoming more and more significant. Certain recent announcements indicate that a regulatory mechanism for the industrial zones’ operators will be established in the following months. It is yet to be seen what the role of municipalities in the management of zones would be and whether the operational centralization is the right move.
Regardless of the legal frame regulating the management of zones, it is important that the municipalities continue to collaborate, where this is justified, and to present themselves as investment centers beyond the scope of the concrete industrial zones. For this reason the merging of Sliven and Yambol is to be welcomed since this is the first case of two regional centers, rather than just a city and its periphery, that promote themselves together. But there are plenty other opportunities, such as the eventual new zone between Gabrovo and Sevlievo or a potential merging between Stara Zagora and Kazanlak which at the moment work independently with the National Company. A good starting point for the possible collaborations is the IME’s analysis of the economics centers in Bulgaria.