Economic Centres - 2023
Economic Centers in Bulgaria – 2023 is a publication focused on research aiming to examine and present the concentration of economic activity in Bulgaria and to outline the country’s broad economic centers. It is based on industry indicators, labor market data, as well as data on the economic interconnections between municipalities. The economic centers thus defined are not limited to the administrative and territorial division into districts, planning regions, etc. The research carried out by IME is based on comprehensive data collected from the audits of non-financial enterprises and on detailed data from the 2021 census, which allows tracing daily labor migration between the country’s municipalities.
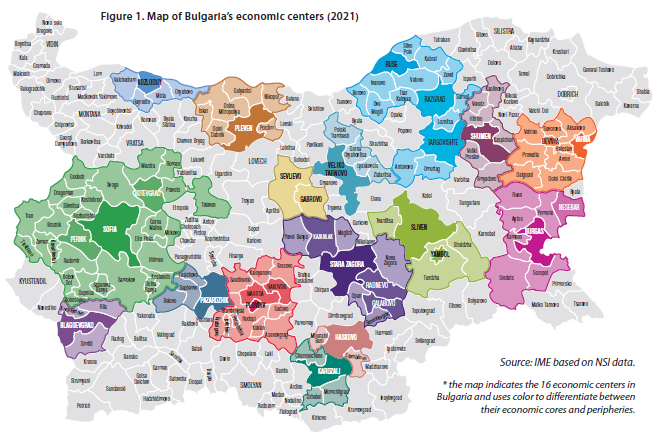
Economic centers consist of a core and a periphery. The municipalities with the strongest economy are the economic cores, while the municipalities most closely connected with the economy of the respective core make up its periphery. The present IME study outlines 16 large economic centers in Bulgaria, comprising a total of 132 municipalities. Some of the centers have more than one core, which is the result of existing interconnections between the cores within one and the same center and their having a common periphery or zone of influence. The territory of the 16 economic centers contains nearly ¾ of Bulgaria’s population and in them is concentrated over 80% of the country’s economic activity. The economic centers form the greater part of the regional map and the trajectory of their development defines that of the country’s economy as a whole.
DEFINING AND MAPPING THE ECONOMIC CENTERS
Economic centers in Bulgaria are defined based on clear criteria for evaluating the economic cores and their peripheries. Economic cores are those municipalities in which economic activity is concentrated, which attract workers from neighboring settlements and have dynamic labor markets. Their peripheries comprise workforce donor municipalities that are most closely connected with the core.
- Economic cores are those municipalities which serve as drivers of Bulgaria’s regional economy. They are leaders in output and job opportunities and attract significant numbers of workers from neighboring municipalities. To be defined as an economic core, a municipality must meet at least two of the following three criteria: 1) it is among the top 10% of municipalities in production value; 2) it is among the top 10% of municipalities in employment density; or 3) it is among the leading top 10% of municipalities in net daily labor migration.
- The peripheries of the economic centers comprise the municipalities most closely connected with the core’s economy based on daily labor migration. A municipality in which at least 10% of employed persons commute daily to the core for work is part of that core’s periphery. Detailed data from the population census allow for a very precise evaluation of this indicator once every ten years.
The IME study outlines 29 municipalities which serve as the drivers of the regional economy and meet at least two of the above criteria for an economic core. Their peripheries comprise a total of 103 municipalities which meet the criterion of daily labor migration – at least 10% of the employed persons in each of those 103 municipalities commute daily to a job in the respective core. IME’s methodology defines 16 economic centers which shape a large portion of Bulgaria’s economy (Fig.1).
SIZE AND CONTRIBUTION OF THE ECONOMIC CENTERS
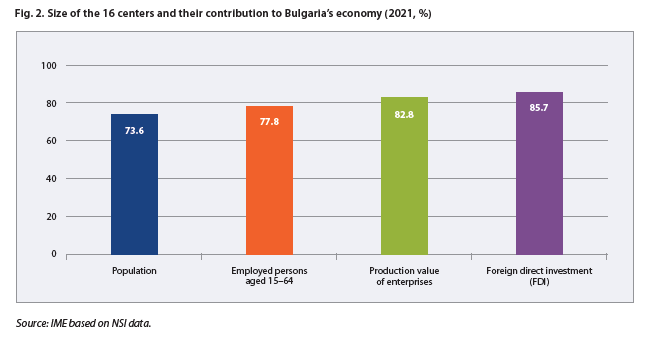
The 16 economic centers as defined by IME comprise 132 municipalities with a population of 4.8 million people (73.6% of the country’s population) and close to 2 million people in employment (77.8% of all employed persons aged 15–64 in the country). In 2021, the production value of the non-financial enterprises in the 16 economic centers reached 178 billion BGN, which amounts to 82.2% of the overall production value of the country’s enterprises. Value added from enterprises in the 16 economic centers reached over 64 billion BGN and has nearly doubled in the past 10 years. As of the end of 2021, the cumulative FDI in the 16 economic centers reached over 24 billion EUR or 85.7% of all foreign capital invested in the country’s economy (Fig. 2).
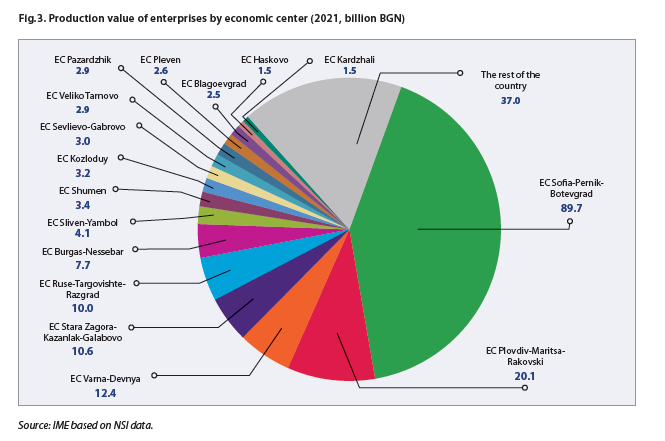
The total production value of the enterprises within the largest economic center, Sofia–Pernik–Botevgrad, amounts to 89.7 billion BGN (41.7% of the output of all enterprises in the country). It is followed by the Plovdiv–Maritsa–Rakovski and Varna–Devnya economic centers, the production value of whose enterprises amounts to 20.1 billion BGN (9.4% of the output of all enterprises in the country) and 12.4 billion BGN (5.8% of the output of all enterprises in the country) respectively. Next are the large economic centers of Stara Zagora–Kazanlak–Radnevo–Galabovo (production value of 10.6 billion BGN), Ruse–Targovishte–Razgrad (production value of 10 billion BGN) and Burgas–Nessebar (production value of 7.7 billion BGN). The remaining economic centers have reported production value of their enterprises below 2% of the total output in the country (Fig. 3).
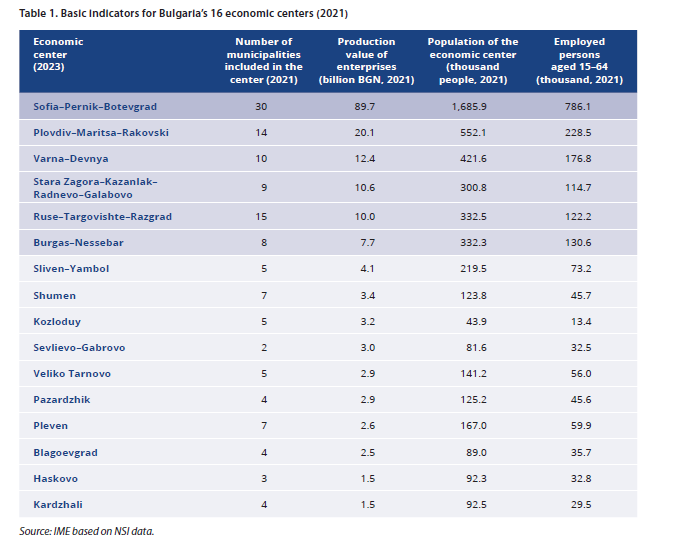
The large economic centers have increased their size in the last 10 years, and the evidence shows both the emergence of secondary cores and an extension of their peripheries. This means that the upswing in the leading economic cores has triggered a certain regional effect, thus providing more municipalities with development opportunities. What distinguishes the leading six centers is that they have two or three cores, as well as a wide periphery. The population in the leading centers exceeds 300,000 people, while the number of employed persons is over 100,000 people (Table 1).
TYPES OF ECONOMIC CENTERS
Bulgaria’s economic centers can be provisionally divided into three groups according to their size. Standing out at the top is the center around Sofia – the unrivalled leader in the country. It is followed by five broad centers around Plovdiv, Varna, Stara Zagora, Ruse and Burgas, which are large in size, have secondary cores and a solid periphery. The leading six economic centers have developed around the six largest cities in the country – the only ones with population over 100,000. They are followed by the remaining ten centers which are smaller in size, have limited peripheries and have a smaller footprint on the regional map.
THE LEADER: SOFIA
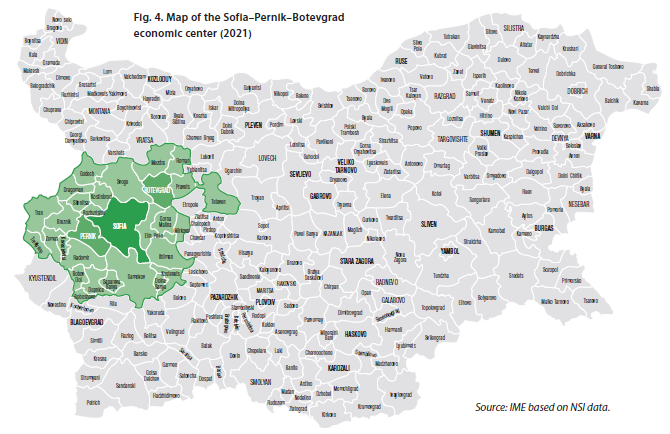
The economic center of the capital has two secondary cores – Pernik and Botevgrad, and comprises a total of 30 municipalities with a population of nearly 1.7 million people (Fig. 4). It should be noted that the two “complementary” cores are also part of the periphery of the capital city municipality. This means that Sofia’s periphery comprises altogether 29 municipalities, with over 10% of employed persons in them commuting every day to their jobs in the capital. Over the past 10 years, the capital has been widening its periphery, thus exerting a very strong influence on the labor markets in the municipalities located in close proximity to the big city – over 1/3 of all employed persons in the municipalities of Svoge, Bozhurishte, Kostinbrod, Gorna Malina, Pernik and Elin Pelin commute daily to the capital for work.
Production value in the Sofia–Pernik–Botevgrad economic center amounts to nearly 89.7 billion BGN in 2021, or 41.7% of the output of all non-financial enterprises in the country. The value added of enterprises is over 35.3 billion BGN and has practically doubled in the past ten years. The center’s population is almost 1.7 million, while the people in employment aged 15–64 number 786,000. The capital’s economic center has the highest share of university graduates (37.6% of the population aged 7 and above), the highest employment rate (71.8% of people aged 15–64) and the highest salaries (a gross average monthly salary of 1,917 BGN in 2021 for people employed in the center).
The capital city municipality, which is the center’s main core, has been performing very well in all these indicators: 43.6% of Sofia’s population aged 7 and above has higher education; the employment rate reaches 75%, while in 2021 the average monthly salary of employed persons was 2,144 BGN. The capital’s demographic indicators have traditionally been good, as it keeps attracting young and active people from all over the country. The big city’s attractiveness and its economic diversity, as well as the development of industry and logistics in the surrounding municipalities, including the secondary cores and the periphery, provide the potential for growth and expansion of the economic center around Sofia.
THE FIVE LARGEST CENTERS RANKED AFTER SOFIA
Besides the broad economic center around Sofia, there are five large economic centers that also stand out on the map, all of them with a wide periphery and significant footprint on the regional map. They are the centers around Plovdiv (Plovdiv–Maritsa–Rakovski), Varna (Varna–Devnya), Stara Zagora (Stara Zagora–Kazanlak–Radnevo–Galabovo), Ruse (Ruse– Targovishte–Razgrad), and Burgas (Burgas–Nessebar). These five centers differ considerably from all others on the map (Fig. 5) in having a population between 300,000 and 550,000, employed persons numbering between 110,000 and 230,000, and production value of their enterprises ranging from 7 billion to 20 billion BGN. In 2021, the average salary of people in employment in the five large centers was roughly between 1,200–1,400 BGN a month and reaching about 2,000 BGN in some of the secondary cores with an industrial focus – Radnevo, Galabovo and Devnya.
The Plovdiv economic center has two secondary cores – Maritsa and Rakovski, and comprises 14 municipalities with a population of 552,000 people. In total, the employed persons aged 15–64 on the center’s territory number 228,500, and over 1/3 of all employed people from the municipalities of Rodopi, Kuklen and Maritsa commute on a daily basis to their jobs in Plovdiv. The Varna economic center has a single secondary core – Devnya, and encompasses 10 municipalities with a population of 422,000. In total, the employed persons aged 15–64 on the center’s territory number 176,800, and over 1/3 of all employed persons in the municipalities of Aksakovo, Avren and Beloslav commute daily to Varna for work. Both centers have a good educational structure of the population, relatively high employment rates and are successful in attracting young and active workforce.
Following the centers around Plovdiv and Varna are those around Stara Zagora (consisting of 9 municipalities), Ruse (15 municipalities) and Burgas (8 municipalities), each of which has secondary cores with population over 300,000. Stara Zagora forms a broad center with as many as three secondary cores – Kazanlak, Radnevo and Galabovo; Ruse also has two solid secondary cores – Targovishte and Razgrad, while the secondary core of Burgas is Nessebar. The number of employed people aged 15–64 in the three centers varies from 115,000 to 130,000 people, and employment rates are within 60–62%. The three centers have similar characteristics, and among the challenges they face are raising educational levels, which includes raising the number of university graduates and of qualified workforce, overcoming the unfavorable demographic processes, as well as sustainability in keeping and attracting young and active people.
THE TEN SMALLER ECONOMIC CENTERS
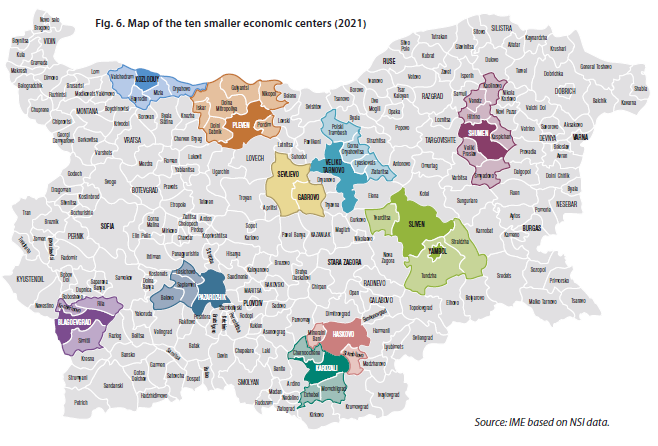
Apart from the unsurprising leader – Sofia, and the five larger economic centers in the country, the IME methodology outlines another ten economic centers – of a smaller size, with more limited peripheries and less significance on the regional map. In the south, those are the centers of Sliven–Yambol, Pazardzhik, Blagoevgrad, Haskovo and Kardzhali. Each of them, despite its smaller periphery, has points of contact with the large economic centers in southern Bulgaria. In the north, the smaller economic centers include Shumen, Kozloduy, Sevlievo–Gabrovo, Veliko Tarnovo and Pleven. Of these, Shumen is the only one with points of contact with the large economic centers in northern Bulgaria. The Pleven and Kozloduy centers, as well as those of Veliko Tarnovo and Sevlievo–Gabrovo have points of contact with each other, though they do not form a common economic center and remain outside the leader cohort (Fig. 6).
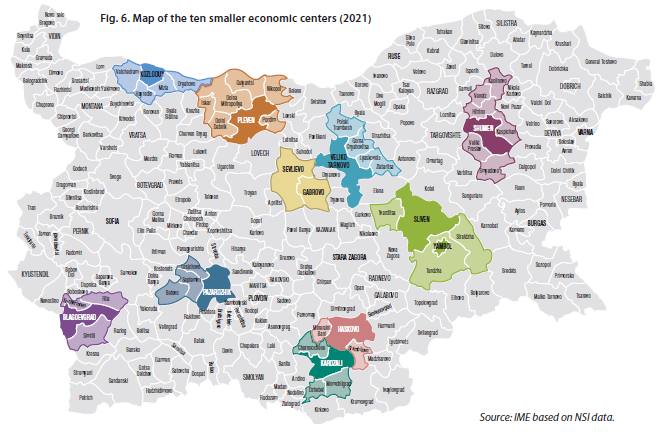
Population in the smaller economic centers varies from below 44,000 people in Kozloduy to almost 220,000 in Sliven–Yambol. The number of people in employment aged 15–64 reaches over 73,000 in Sliven–Yambol, though staying well below the 100,000 people limit which is characteristic for centers such as Burgas–Nesebar, Ruse–Targovishte–Razgrad and StaraZagora–Kazanlak–Radnevo–Galabovo.
The smaller centers have difficulties forming a large periphery: the only ones among them encompassing more than five municipalities are Shumen and Pleven. The Sliven–Yambol, Pazardzhik, Blagoevgrad and Kardzhali centers have formed peripheries of three municipalities each, Haskovo has a periphery of only two municipalities, while the Gabrovo–Sevlievo center has no periphery, though some neighboring municipalities are close to meeting the criterion. The ten centers listed above have their potential but they are consistently challenged by demographic and educational problems. The smaller centers are characterized by both a worsening age structure and a sustained loss of population, including young and active people. There are some exceptions, like the net migration rate in the Kardzhali economic center in recent years but generally speaking, demographic processes have curbed the potential of those secondary centers. They also have lower shares of population with university education: the Veliko Tarnovo, Blagoevgrad and Sevlievo–Gabrovo centers are the only ones with ¼ or more of the population aged 7 and above with university degrees. The less favorable educational structure in most of the secondary centers entails both lower employment levels and lower salaries compared with the leading centers.
THE ECONOMY BEYOND THE CENTERS AND SPECIFIC CASES
The economic centers have over 80% of the country’s economy concentrated in them. That is not to say, however, that in the remaining parts of the country there are no economic areas worthy of attention. The 16 economic centers presented here are leaders in scale but they are not the only ones solely indicative of either the variety of economic activity or the economy’s potential as a whole. Various examples of specific economic centers can be found on the regional map, as well as examples of centers, mostly formed around district capital cities, which have their own zones of influence, though on a smaller scale.
An interesting example in point is the economy of the region skirting the Sredna Gora mountain and Etropole. It is markedly specific and is dominated by several large enterprises, including the largest manufacturing company in the country located on the border between Pirdop and Zlatitsa, as well as the extraction companies in Chelopech, Panagyurishte and Etropole/Mirkovo. These companies’ operation has a powerful regional effect, with some of the small municipalities near Sredna Gora and Etropole leading on various economic indicators. The region’s specifics, however, including the effect spreading to several small municipalities, do not allow the formation of an economic center as defined by the methodology used in the present study.
THE CENTERS AS A BASIS OF REGIONAL DEVELOPMENT
The examination of the economic centers situates the issue of regional development in a different perspective. It allows foregrounding the regions’ potential for development rather than their differences. Within the 16 economic centers thus defined is concentrated a large portion of the country’s economy, but their potential and development trajectories vary a lot. What stands out quite clearly is that there are centers of different types, with the center around the nation’s capital – Sofia as the unquestioned leader, followed by the five large economic centers formed around the cities with population over 100,000, while the ten smaller centers have a limited sphere of influence.
The map of the country’s economic centers allows for some important observations. Notably, the large cen centers in the south often hold together several cores and have more points of contact. The leading economic centers around Sofia, Plovdiv, Stara Zagora and Burgas form secondary cores and with their peripheries, they cover a large part of the territory south of the Stara Planina mountain. Alongside the huge periphery of the center around Sofia, those around Plovdiv and Stara Zagora are telling examples of the beneficial effect produced by the better connectedness between different economic zones and the possibility for interaction between them.
In the north, similar interaction can be observed in the broad zones around Varna and Ruse, where secondary cores are formed and the periphery is large enough to stand out on the regional map. However, in the northwest and in the Northern central region there are centers smaller in size and with limited economic impact. The economies of Veliko Tarnovo, Gabrovo and Sevlievo, as well as those of Pleven and Kozloduy, would be of a different scale if they formed joint centers. However, neither the connectedness between them, including the condition of the infrastructure, nor their economic interaction is sufficiently developed to prevent them from remaining separate centers with smaller zones of influence.
The economic centers’ dynamics examined here lays the foundation for tapping additional potential for regional development. The leading centers are successful in profiting from the combination of the attractiveness and diversity of the big city with the development of industry and logistics in the wide periphery, including by forming secondary cores. Sofia is a case in point, but a similar development can also be observed in Plovdiv and Varna. The peripheries and the secondary cores of the three leading centers contain some of the municipalities with the strongest manufacturing in the country.
The remaining large centers, similar in their size though not dominating the regional map in any similar ways, can profit from the interaction with strong secondary cores. Stara Zagora and Ruse, as well as to a certain extent Burgas, are examples in point: the interaction of several comparable economic cores has as its end result the formation of a single large economic center. Interaction of a similar type, be it between a large core and an industrial periphery, or between two economic cores with comparable population and scale of economic activity, ultimately results in a stimulating effect capable of transforming the regional map.

The second edition of the Economic Centers study aims to go beyond the administrative and territorial division into districts and regions and draw new internal boundaries in the country based entirely on natural economic processes. On the basis of key macroeconomic and social indicators, it outlines the leading economic centers in Bulgaria, defines their strengths and weaknesses and identifies established and active patterns of development.
The study relies on several concepts and definitions specially developed for its purposes, namely economic center, economic core and periphery. To be classified as core or periphery, the municipalities included in the analysis have met several criteria.
- ECONOMIC CORE
These are the municipalities that drive the local (and in most cases, the national) economy, that attract workers from surrounding municipalities and are leaders in employment and production. To qualify as an economic core, a municipality must meet at least two of the following criteria:
To be in the top decile in terms of daily labor migration – high positive labor migration is a sign that an economic core is able to attract workers from neighboring municipalities. The top ranked municipalities on this indicator tend to outperform others on many more economic indicators as well. The restriction to the top 10% of municipalities does not result in key municipalities dropping out, as below the 10 % threshold, the net daily labor migration is close to zero – in other words, almost all municipalities with a positive balance of commuting employees fall into the chosen decile. In this edition, municipalities attracting less than 4,000 daily labor migrants remain outside this criterion.
2. To be in the top decile in terms of employment density – this criterion indicates how densely located jobs are in individual municipalities. Most calculation methods take into account only actual working space, but due to lack of such data in Bulgaria, this study uses the ratio between the number of employees in the municipality and its total area. Similar to the previous criterion, this one does not fail to include municipalities with high economic importance, as employment density decreases sharply outside the top 30 municipalities in the ranking. According to this criterion, the cores are municipalities with more than 30 employees/sq. km while almost all of those with more than 20 employees/sq.km fall on the periphery of various centers.
3. To be in the top decile in terms of production value – unlike the other two criteria, production value is an absolute (not relative) measure of the economic output of individual municipalities. This indicator allows ranking municipalities according to their importance for the national economy as a whole. According to the 2021 data, this criterion ‘draws the line’ at economic cores with production value of 1.4 billion BGN per annum, while municipalities with production worth over 1 billion BGN do not meet this criterion but are still classified as cores based on the other two criteria.
The criterion of highest significance in defining economic cores is production value – of the 29 municipalities that meet two of the criteria, only Kurdzhali, Nessebar and Rakovski are not in the top decile based on this one. 10 municipalities do not meet the employment density criterion, and Devnya is the only one that fails to meet the labor migration criterion, the reason being its proximity to Varna, which is among the leaders in daily migration. All three criteria are met by 16 municipalities, where a large part of the economic activity nationwide is concentrated.
- PERIPHERY
The peripheries formed around the economic cores include those municipalities where more than 10% of employees commute daily to the core for work. This threshold is relative and not absolute, so that it can reflect differences in population size between municipalities, as well as allow for straightforward comparison between economic centers. Otherwise, either very large portions of the country’s territory would fall within the economic center around the capital, or many of the economic centers under discussion would remain below the threshold. In the current edition of the study, 119 municipalities meet the criterion of being in the periphery of an economic core, while almost all centers have succeeded in expanding their territory compared to the previous edition.
- ECONOMIC CENTER
The concept here refers to the economic core plus its adjacent periphery (if any). There are also centers with several cores (Sofia–Pernik–Botevgrad, Plovdiv–Maritsa–Rakovski, Varna–Devnya) which have shared economic influence on the surrounding municipalities. However, these core may be primary or secondary, with the current edition identifying the formation of new secondary cores in the largest centers. There is also one center with two cores that qualify as economic cores but have no periphery – this is Sevlievo–Gabrovo. In total, there are 29 economic cores in the country, with 16 economic centers formed around them, the latter comprising 132 municipalities (compared to 92 in the previous edition of 2017), or almost half the country’s municipalities. They account for the majority of both population and economic activity.
- MAIN INDICATORS
The main objective of the analysis is to examine the structure and development of the local economy, the labor market, the demography and the education in the individual economic centers. The indicators used for this purpose are grouped into three categories as follows:
Economy and investment
- Production value: the value of turnover minus the carrying amount of assets sold, less that of own fixed assets, including the change in stocks of finished goods and work in progress, as well as the costs incurred for self-constructed assets. In the present study, the indicator is used to determine the share of the different industries in the centers’ economy, as well as the trends for their development over the years.
- Foreign direct investment (FDI): FDI (cumulative) at the end of the year is used, calculated as foreign equity participation in enterprises plus net liabilities between domestic and foreign investors. FDI is a standard indicator of both investment and investment climate.
- Expenditure on the acquisition of fixed tangible assets (FTA): expenditure on the purchase of land, the construction of buildings, the purchase of machinery and the like, plus services related to these activities, excluding the maintenance of existing tangible assets. FTA is an indicator of investment activity in the economic centers.
- Export revenue: the indicator describes the export revenue of non-financial enterprises in the municipalities. The size of the export revenues allows the identification of the most export-oriented municipalities within the economic centers.
Labor market
- Number of persons employed: the number of persons employed in a labor or service contract and receive a salary, whether the contract is permanent or temporary, for full-time or part-time work. The indicator shows the distribution of employees across economic activities and the dynamics between sectors.
- Employment rate: the relative share of employed persons in the total population of a municipality (in the relevant group) according to the 2021 census. Unlike the data for employed persons, which in statistics are allocated to municipalities depending on these persons’ actual place of work, the employment rate is a descrip tor of employed people according to their place of residence.
- Gross salary: the remuneration received for performed work before mandatory and voluntary social and health insurance and tax deductions. The indicator represents in full the remuneration in the different sectors of the centers’ economy, with the average value for the respective center being weighted relative to the number of employees in the different sectors of the municipalities making up the centers.
- Unemployment rate: calculated by dividing the average annual number of unemployed persons registered in the labor offices by the size of the economically active population. Measured as percentage, it shows the share of the unemployed in the labor force. The unemployment average for an economic center is estimated in relation to the population of the individual constituent municipalities for the given year.
Human resources and workforce
- Population: the end-of-year sum of the number of residents in the municipalities making up the economic centers.
- Working-age population: the sum of the number of 15–64 age group residents in the municipalities making up the economic centers.
- Natural growth rate: the difference between the number of births and the number of deaths in the municipalities making up the economic centers as a proportion of their total population.
- Net migration rate: the difference between the number of people having settled in and the number of those who have moved out of the municipalities making up the economic centers as a proportion of their total population.
- Demographic replacement rate: the ratio of those entering or about to enter the labor market (aged 15–19) to those about to leave it (aged 60–64) in the municipalities making up the economic centers. The ratio describes the ability of economic centers to reproduce their labor force in the near future.
- Educational structure of the population: the proportion of residents in the municipalities making up an economic center who have completed the different levels of education, relative to the total population of that economic center.
- Average grade in the matriculation exam in Bulgarian language and literature (BLL): the average grade in the BLL exam is weighted relative to the number of students who took the matriculation exam in the respective year.
Latest news
All municipal projects can start this year – here's how 04.03.2026
Is it possible for all municipal projects in the state budget – worth a total of over 4 billion euros –...
Regional inequalities are growing 02.03.2026
Deep regional inequality remains one of the most persistent challenges to Bulgaria's economic development....