Quality of Life in Bulgarian Districts
The usual methodology in the estimation of quality of life is to assess it on a national level, not on a regional one. With the exception of several publications, ranking the cities in various countries, there are no studies, which rank individual regions.
Studies on a national level can be divided into two types – objective and subjective. The latter ones use various public polls in order to calculate an estimate of the quality of life. The objective studies are based on different statistical data, combined into one final value, which measures quality of life. Such studies are for example The Economist Intelligence Unit’s Quality-of-Life Index from 2005, the popular Human Development Index, and the OECD’s Better Life Index.
The assessment “Quality of life in the districts”, drafted by the IME, is an attempt to combine the methodologies the globally recognised indices and apply them on a regional level in Bulgaria. The goal of the assessment is to be, as much as it is possible, yet another factor used when comparing the different districts in Bulgaria. In order to minimize subjectivity, the different indicators are given equal weights in the final result. This assessment is base on the IME’s study “Regional Profiles: Indicators of Development”.
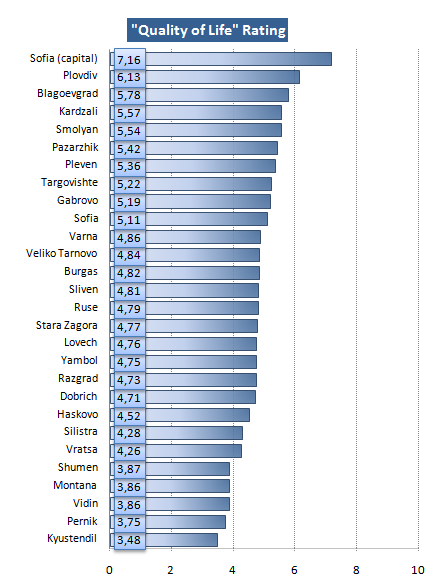
Source: IME’s calculations
As is obvious from the districts ranking, the presence of a large district centre does not always mean a better quality of life. The traditionally cited as large and prosperous districts of Varna and Burgas give way to smaller ones, such as Gabrovo and Pazardzhik. The large difference between Sofia (capital) and the rest of the districts is due to its good performance in one indicator, but in several Sofia lags behind. This is one of the main strengths of the index – first place in one of the sub-factors is not enough to raise the district to a high level. Some other main conclusions, which can be drawn from the study, are:
- Sofia takes first place in five of the indicators and last place in the crime indicator;
- Pernik is in last place in three of the indicators;
- Stara Zagora loses a couple of places, because of its weaker (compared to other districts) performance in the indicator “Emissions of pollutants in the atmosphere”;
- Kardzali takes first place in three of the indicators and shows an overall good performance in the rest;
- Plovdiv has only one first place, while Blagoevgrad takes one second place, but the overall performance of the two district puts them on second and third place in the final ranking respectively;
- Varna and Burgas are in lower positions compared to the leaders, mainly because of their weak performance in the health, crime, and quality of roads indicators;
- Burgas shows a weaker performance compared to the rest of the districts in the average annual income indicator;
Methodology
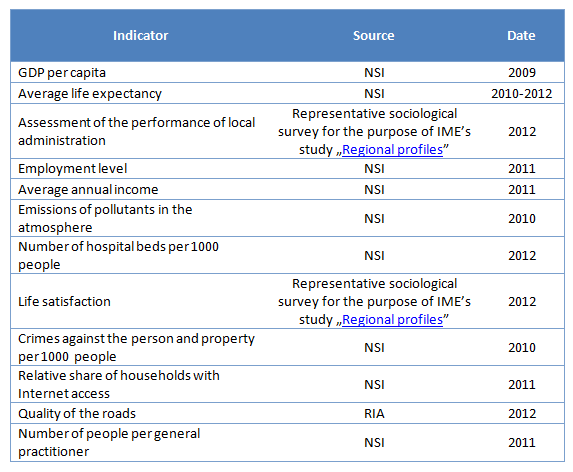
When assessing the performance of the districts, we’ve used only data from the latest available. Because of the nature of the used data and the method of its collection, this year varies (2009 to 2012). You can see the specific indicators and their relevant years below.
The next step is to normalise the data. This way the data are equated to values close to one another. In our case, the normalisation takes the highest value as 1 and the lowest value as 0. The rest of the data is spread between these two values.
The resulting values are then averaged by the number of indicators (12). This means that they are effectively given equal weights.
The project "Regional Profiles: Indicators of Development" is carried out with the support of the America for Bulgaria Foundation.

