Municipalities and the Matriculation Exam in Bulgarian - Results in 2019
Unlike previous years, when the publication of open data on matriculation results was delayed almost until the end of the year, this time they were published much earlier. This, in turn, enables the IME to calculate the average grade at the municipal level, which is not formally published by the Ministry of Education, but is a useful comparative metric for the performance of students at the lowest regional level.
The map below shows the average grade of the state matriculation exam in Bulgarian Language and Literature (BLL) for 2019 at the municipal level. The calculation of the average grade of a municipality is based on the average grades of the schools in it, weighed in accordance with the number of students who took the exam in each of them. We only present the BLL exam results since it is mandatory and all final-year students take it.
Map 1: Average grade at the BLL matriculation exam in 2019 at the municipal level
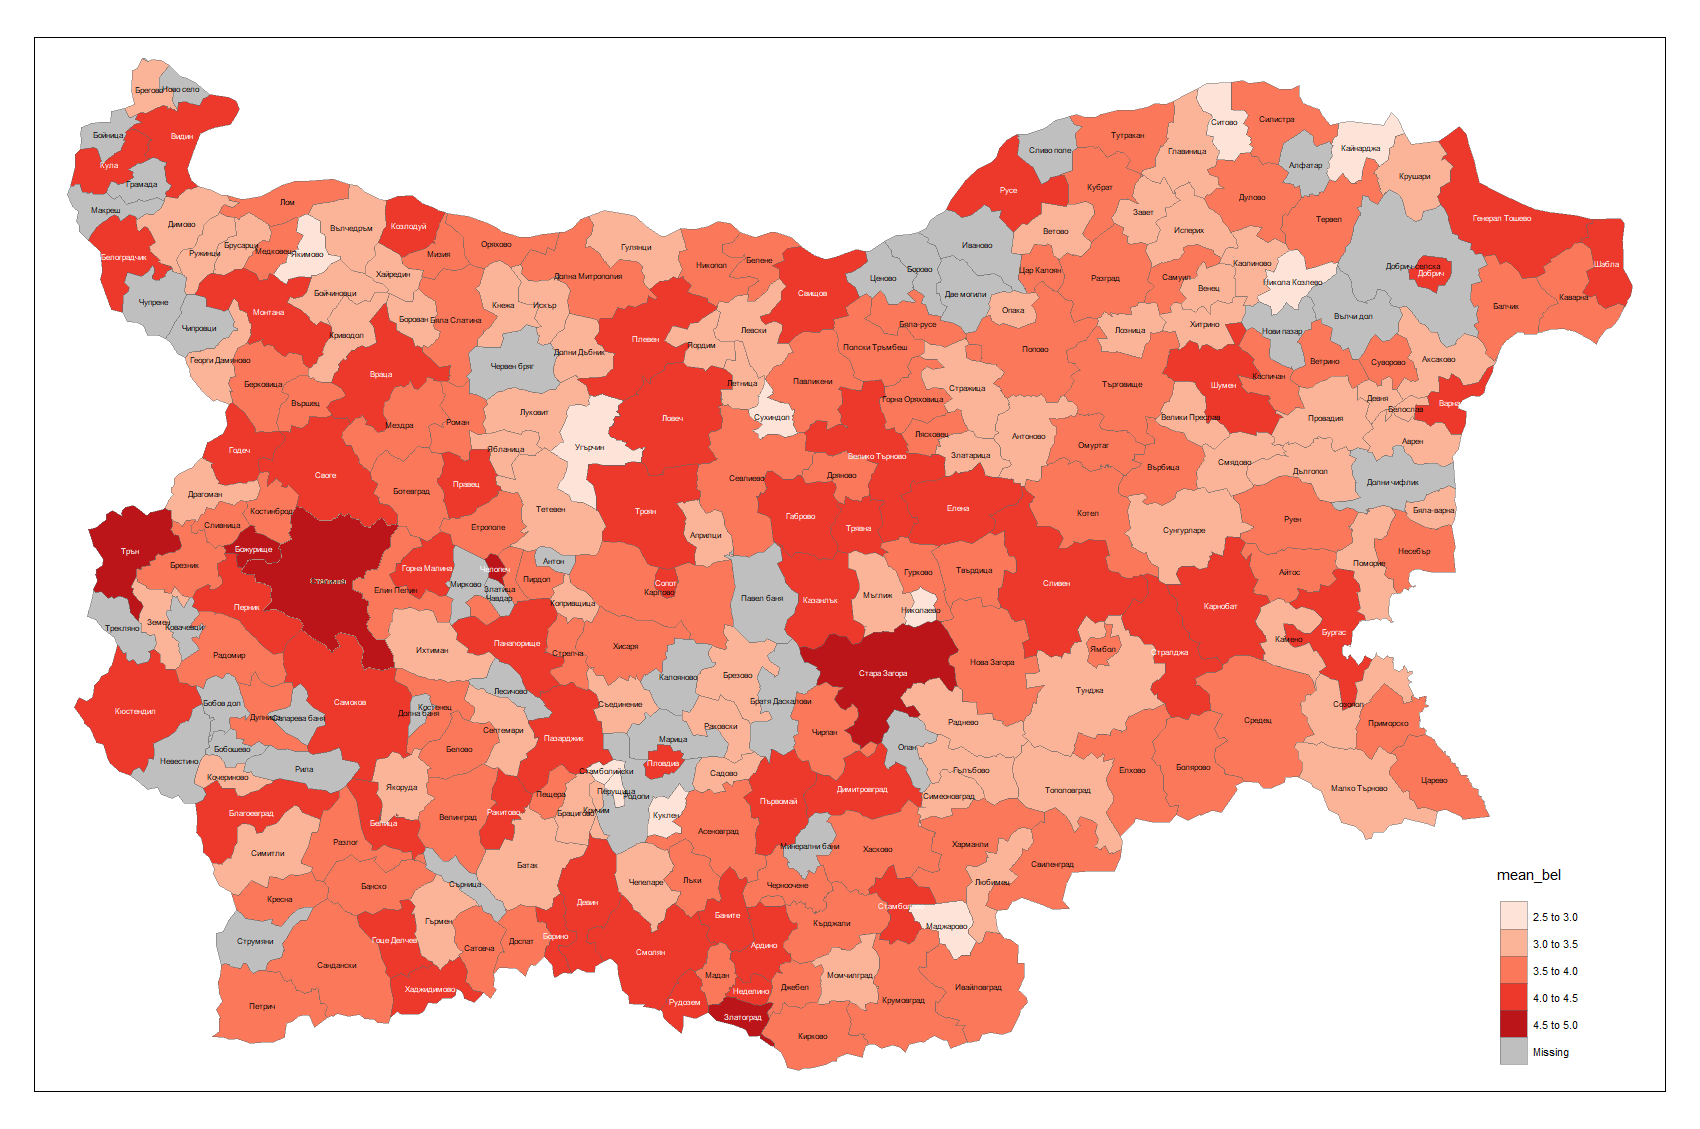
The trend continues whereby the number of municipalities with an average BLL grade under 3 rises – while they were 5 in 2018, they are now 12, two of which have an average of exactly 3.00. Only one municipality achieves an average grade of 5.00 – Tran, although higher results are often achieved in municipalities with few students taking the exam which leads to great annual variances in the average results there. Most municipalities’ results fall between 3.70 and 3.90. The majority do not experience significant changes compared to previous years and where there is a notable difference, it is mainly due to a very small number of students attending the exam. Where results are different, they are slightly higher but not significantly so.
This year’s data confirms the conclusion that results are a function of the size of the municipality and generally bigger schools in larger municipalities score better. The only exceptions are municipalities with few students taking the exam but there results vary greatly between the years. Conversely, the biggest municipalities – Sofia-city, Plovdiv, Varna, Burgas, - where the country’s leading schools are, continuously rank among the best.
Provoking interest are the results of some smaller municipalities which have been in the leading positions in the recent years, – Chelopech (4.74), Zlatograd (4.61), Rudozem (4.32), and Buzhurishte (4.85) – since there is no evident factor in common between these.
There remain a few uncertainties as to the methodology according to which the Ministry of Education and Science evaluates the grade average for the country. Because the data at the school level allows us to make an independent evaluation, we find that for 2019 the average BLL grade measured as the average at the school level weighed according to the number of students is Good 4.13, rather than the official Good 4.06. The difference is not significant, but it remains clear that the Ministry must be using a different method.