Which Branches of the Economy Are Dominant in the Regions And How Sectoral Distribution Relates to Poverty Levels?
* Stoyan�Hristov
During the analysis of regional development, an interesting question arises: is the domination of different economic branches a factor when it comes to poverty levels or wealth in the region? In order to be able to answer this question, we are going to use data from the recently published survey “Regional Profiles – Indicators for Development”.
One of the ways to explore whether such a link exists is to use the gross value added (GVA) of each branch in the districts. The data for 2009 (the most recent data available) shows that the sector of services accounts for the largest portions of GVA in 24 of the regions. In the remaining four – Sofia district (62%), Stara Zagora (58%), Gabrovo (48%) and Vratsa (46%) – the leading branch is industry. In regions where large cities are present the trend is for services to take the largest part; here the city of Sofia features as leader with its services branch amounting to almost 79%, followed by Varna where services hold 68.6%.
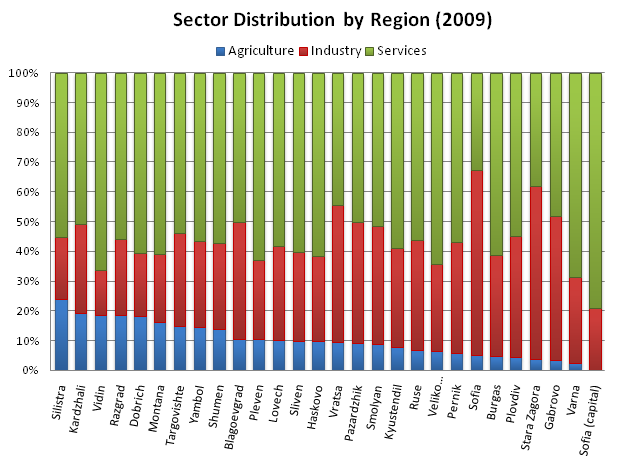
Source: NSI
As expected, according to the data, agriculture makes for a rather small portion of GVA in all regions and the country as a whole. The next graph shows the interconnection between the size of the agricultural branch and the economic development of the region.
The main indicator for the degree of regional development is GDP per capita. The following graph shows the reverse relation between GDP per capita and the share of the agricultural branch in the economy of the region[1]. Given this negative trend, two separate groups stand out. The first group is comprised of regions with relatively well-developed agricultural branch and a GDP per capita lower than the country average. The second one encompasses regions with relatively underdeveloped agriculture and a GDP above the country average.
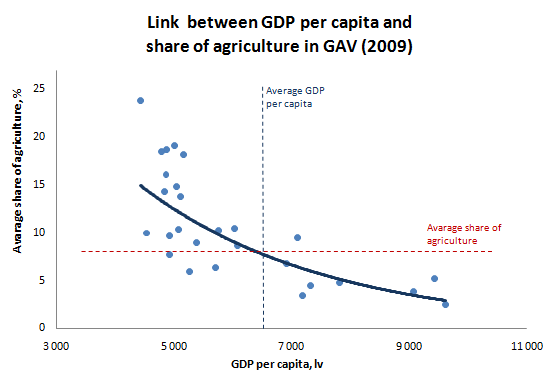
Source: NSI
This leads to two separate conclusions. The data show that regions with a higher portion of agriculture in their GVA – above the country average – have relatively weaker economies. Examples for this are regions like Silistra, Vidin and Razgrad, which have a relatively large agricultural branch and feature a rather bad economic state and negative demographic trends[2]. On the other hand, the number of regions in this first group is bigger. Put in other words, these are the less populated areas, which fall behind according to a big number of indicators. If we compare these data with the “Regional Profiles: Indicators of Development” survey, we will reach the same conclusion. The average score in the “Economy” indicator is “unsatisfactory” for the first group and “good” for the second one.
On the other hand, the economically well-developed regions have a relatively underdeveloped agricultural branch – below the country average. There is only one exception – Vratsa region – and even there the share of agriculture is above 14 per cent lower than the leader in this respect – Silistra. In other words, the most developed regions in Bulgaria, according to the majority of indicators, fall in the second group. According to IME’s survey, these regions are also the ones with the best environment for business development (Stara Zagora, Targovishte); they also have the best socioeconomic state (Bourgas, Varna, Plovdiv) and have the most promising development trends (Ruse, Sofia).
Does this all mean that the population of these regions is poorer? The results depend on how we define poverty: 1) As an absolute indicator (income) or 2) as the standard of living above the poverty level. The first option covers what we had just shown – the economic development of the regions – and the results are fairly similar. NSI provides us with a second option. If we look at the poverty and social inclusion indicators we are bound to notice that there is a connection – albeit not a strong one – between the relative share of the agricultural branch and the poverty line. The graph below shows that with an increase of the share of the agricultural branch the poverty line drops lower[3]. This is to say that a lower income is necessary to maintain a standard of living above the poverty line in these regions – the standard of living there is lower. Despite that fact, if we consider the share of the population living below the line of poverty, we will see that these numbers cannot be linked to the size of the agricultural branch.
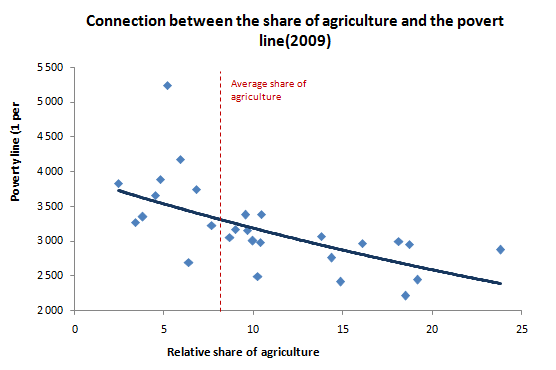
Source: NSI
To summarize, we can safely say that despite the small share of the agricultural branch in Bulgaria it is obvious that it is inversely related to the socio-economic development of the regions. However, when it comes to poverty, this link cannot explain why certain regions are poorer than others or why the number of poor people is bigger. Still, we can state that in the regions with a better-developed agricultural branch the poverty line is lower, which is an indicator for the standard of living in these regions.
*The author is an intern at IME

