What If We Exclude Sofia?
Yavor Aleksiev
We will try to answer what would happen to the average indicators regarding the economic development if the capital city was not taken into account.
This has been a frequently raised question, especially when an indicator had demonstrated a favourable trend. For instance, unemployment has decreased in Bulgaria. Emphasising this positive trend entails comments of the following kind: “This is because of Sofia.” As we are going to prove herein, reality is actually this one in some instances. Simultaneously, there are indicators and periods of time that are otherwise different.
We have analysed 4 indicators: the rates of employment and unemployment of the population 15+, the foreign direct investments (FDIs) and the investments in fixed tangible assets (FTAs) per capita. The first two indicators are key for defining the state of the labour market, and the second pair explains the investment activities, which are one of the milestones of economic development.
Labour Market: Rates of Employment and Unemployment
Figure 1: Difference between the country average unemployment rate and the employment rate of the population 15+ if the capital city was not taken into account
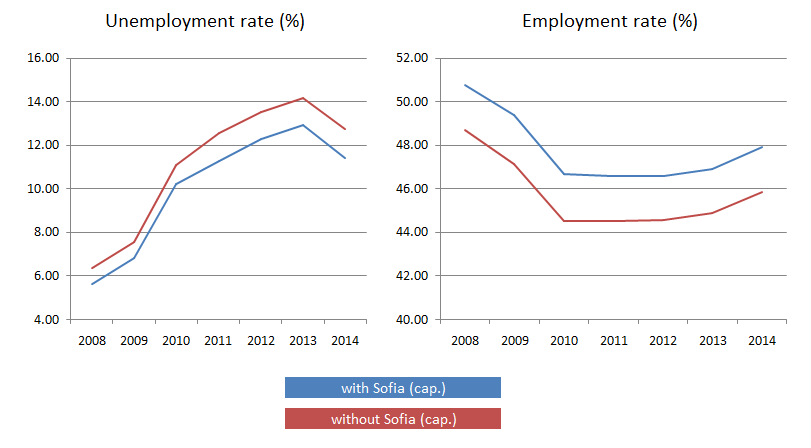
Source: The NSI, calculations by the IME
If the capital city was not considered, the national average unemployment rate would have been about 1.32 percentage points higher in 2014, and the employment rate would have been 2.08 percentage points lower.
Although this effect was different from 2008 to 2014, there is no evidence of any change in the capital city’s impact of the rates of employment and unemployment regarding the country average levels. Although the difference between the national indicators pertaining to the unemployment rate, including and excluding the capital city, increased from 0.74 percentage points in 2008 to 1.32 percentage points in 2014, the higher base (the country’s unemployment rate of 11.42% in 2014 compared to 5.61% in 2008) means that the effect was almost unchanged.
In respect of the employment rate, not considering the capital city entails a national decrease of about 2 percentage points regarding the entire period of the analysis.
Figures 2 and 3 demonstrate the districts that would have performed better than the country’s average unemployment rate in 2014 and that would have had better employment rates if the capital city was not taken into account.
Since the unemployment rate, excluding Sofia (Exhibit 2), would have become 12.75%, the districts of Veliko Tarnovo and Sofia would have performed better (11.7%, 12.7% respectively).
Figure 2: Annual average unemployment rate in 2014 (%)
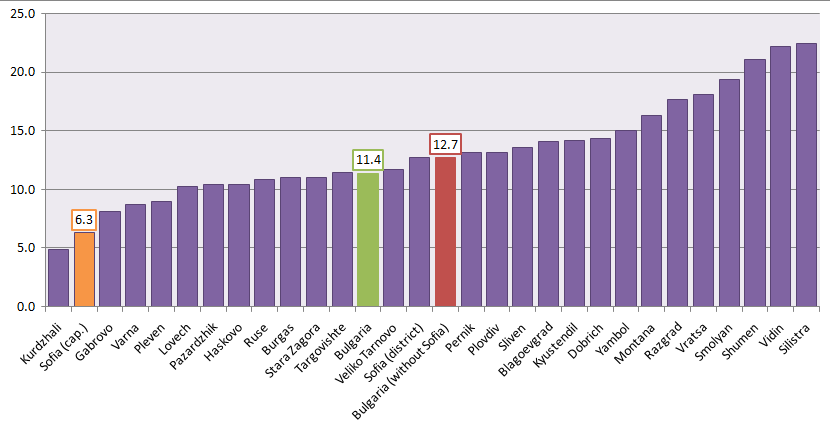
Source: The NSI, calculations by the IME
If the capital city was excluded, the average employment rate regarding 2014 would have dropped from 48.0% to 45.8%, meaning that the employment rates in the districts of Haskovo (47.5%), Pazardzhik (47.3%), Shumen (47.2%), Veliko Tarnovo (46.5%) and Pernik (46.2) would have exceeded these levels, i.e. these districts would have performed relatively well in respect of the employment rate if the capital city is not taken into account.
Figure 3: Employment rate of the population 15+ (annual average) regarding the year 2014 (%)
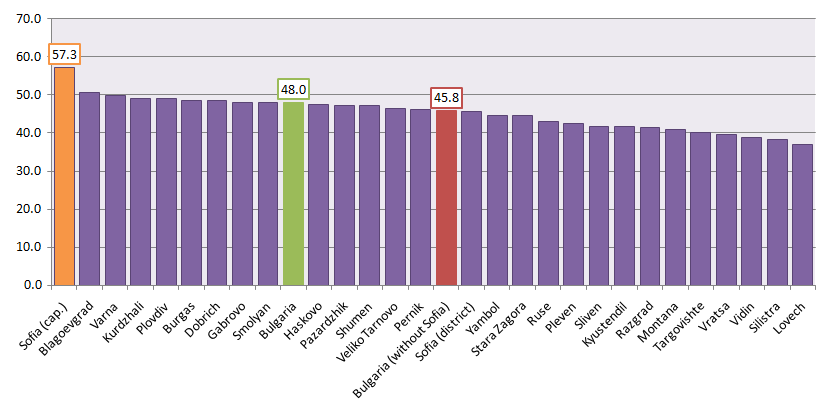
Source: The NSI, calculations by the IME
Investments: FTA and FDI
The capital city’s influence on the national average levels of investment activities is considerably stronger than the one of the labour market. Regarding both indicators that are taken into account herein (FDIs in non-financial enterprises (cumulative) and investments in FTAs per capita), the exclusion of the capital city results in a substantial slump concerning the average values.
In order to illustrate these dynamics throughout time, the difference regarding both types of investment is demonstrated (Exhibit 4) if the capital city was not considered. It is obvious that:
The exclusion of the capital city, regarding FDIs (the blue line), entailed a decrease in the average rate of investments by 101 euros per capita in 2000. The difference between the nationwide average levels, with and without the capital city, reached 1,449 euros per capita till 2009, and a certain drop was registered thereafter. The drop was due to the outflow of FDIs from the capital city during certain crisis years and the simultaneous inflow of investment to other district like Burgas.
The exclusion of the capital city, regarding FTAs (the red line), entailed a decrease in the average rate of investments by 156.3 euros per capita in 2000. The difference between the nationwide average levels, with and without the capital city, reached 695 euros per capita till 2008, and a quick drop was registered thereafter in 2013, to 391 euros per capita.
Figure 4: Difference between the cumulative rates of FDIs (euros per capita) and the yearly expenditure on FTAs (euros per capita), and the same national indicators excluding the capital city (2000–2013)
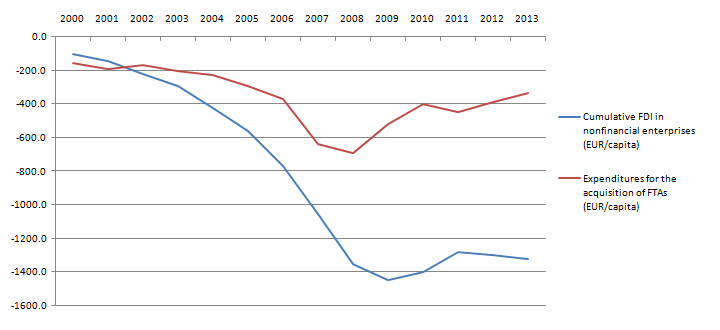
Source: The NSI, calculations by the IME
The districts that would have surpassed the national average FDIs and investments in FTAs per capita in 2013—if the capital city was not considered—are visible on Exhibits 5 and 6.
Since the average level of the attracted FDIs (cumulative) would have dropped from 3,213 euros per capita to 1,890 euros per capita as at 31 December 2013, if the capital city was not considered, the districts of Varna (3,005 euros per capita), Stara Zagora (2,437 euros per capita), Plovdiv (2,436 euros per capita), and Gabrovo (2,172 euros per capita) would have performed better.
Figure 5: FDIs (cumulative) in non-financial businesses as of 31 December 2013 (euros per capita)
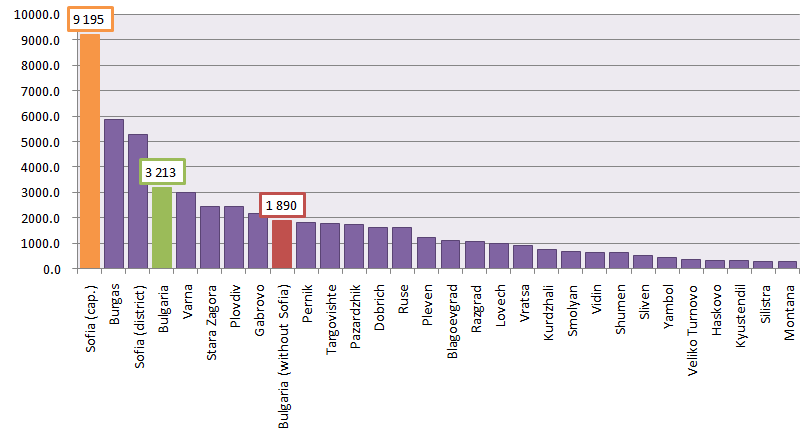
Source: The NSI, calculations by the IME
The average level of investments in FTAs would have fallen from 1,274 euros per capita to 940 euros per capita in 2013 if the capital city was excluded. Therefore, the districts of Varna (1,220 euros per capita), Plovdiv (1,172 euros per capita), Stara Zagora (1,055 euros per capita), Dobrich (1,050 euros per capita), and Ruse (976 euros per capita) would have had higher average levels.
Figure 6: Expenditure on acquiring FTAs in 2013 (euros per capita)
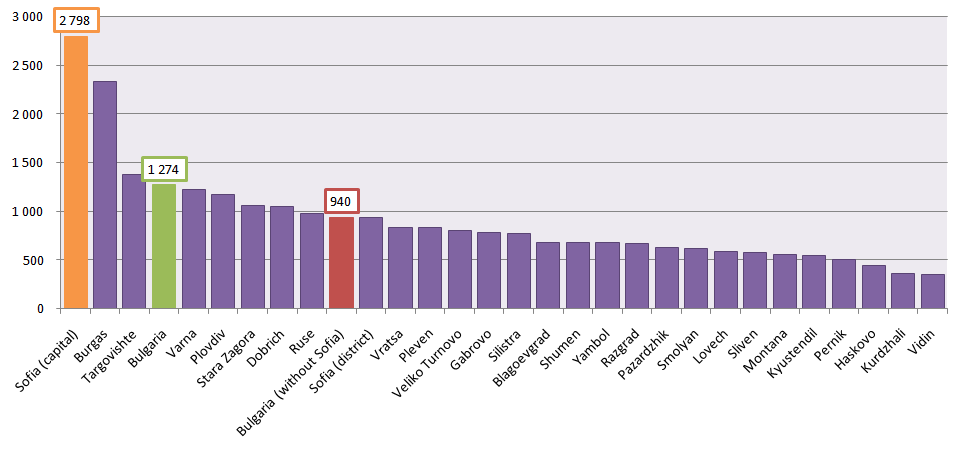
Source: The NSI, calculations by the IME
The review of these data shows the considerable effect that the capital city has had on the national average values of a certain number of the most used indicators, in the field of the labour market and investments. And despite the fact that the deterioration of certain indicators would have been absolutely normal if the leading economic centre of Bulgaria was not considered, their dynamics in time suggests some interesting observations:
1) In respect of the labour market (and in particular, the rates of unemployment and employment), the capital city’s influence is relatively moderate, and no obvious trends of change are noticeable.
2) In respect of investments, it is visible that investment activities in the capital city have had smaller (though significant yet) impact on the national averages. This has been mainly due to both the net outflow of foreign capital from the capital city in 2010 and 2011 and the higher growth rate of FDIs in 2012 and 2013 in other districts, such as Burgas, Pazardzhik, Plovdiv, and Stara Zagora.
These four indicators are far from being sufficient to explain the capital city’s effect on the country’s average indicators regarding the economic development, but they constitute a good basis for an initial analysis. Other comparisons will also be made in subsequent texts.

