Regional Differences in Bulgaria and the EU
Yavor Aleksiev
The latest data on European regional development clearly show that Bulgaria is by far not the only country where regional differences are not only significant, but are also becoming greater. There are basically no countries which manage to simultaneously increase the wealth in their poorest and richest regions, while at the same time achieving a meaningful internal convergence.
A brief look on Bulgaria
The differences between the poorest and richest Bulgarian region (Northwest and Southwest) remain significant. While GDP per capita (expressed in purchasing power standard) of Northwest Bulgaria is barely 29% of the EU average, Southwest Bulgaria has reached 76%, primarily due to the development of the capital city. The gap between the two regions widened primarily in the 2006-2010 period, when the indicator for Southwest Bulgaria increased from 59 to 77% of the EU average, while the increase in Northwest Bulgaria was only from 26 to 28%. In 2015 the country average reached 47 % of the EU average, but all regions, except the Southwest, remain far from this rate. The closest to it are the Northeast and Southeast regions (39%).
Regional differences in Europe
The first figure shows the poorest and richest regions in each of the countries that have more than one region in Europe and for which Eurostat published comparable data for 2015. The average value for each country is also shown.
Fig.1 GDP per capita (PPS) as % of EU average (2015)
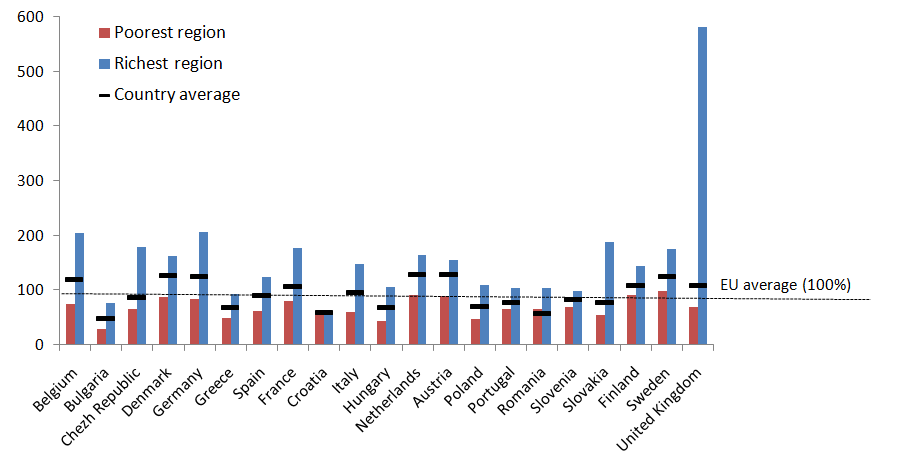
Source: Eurostat, IME calculations
In percentage points the difference varies from 512 pp in the UK to barely 4 pp in the Croatia, while in Bulgaria the difference is 47 pp – the sixth lowest in the EU.
Change in the 2006-2015 period
During the 2006-2015 period regional differences decreased significantly (by more than 10 pp) in 6 out of 21 countries with comparable data and increased significantly (more than 7 pp) in 7 countries, Bulgaria among them. We should mention that in most of the countries with diminishing differences (Belgium, Portugal, Greece and even Romania) this process is due to the decrease of the relative wealth in the richest region and not because of faster economic development in the poorest one. In Austria the dynamics is bipolar – there is a clear wealth increase in the poorest region and a mild decrease in the richest one. Only in Germany there is a clearly visible convergence process – the richest region maintains its level of wealth (without increasing it), and the poorest one slightly improves its position.
Fig.2 Increasing and decreasing differences (2015/2006), pp
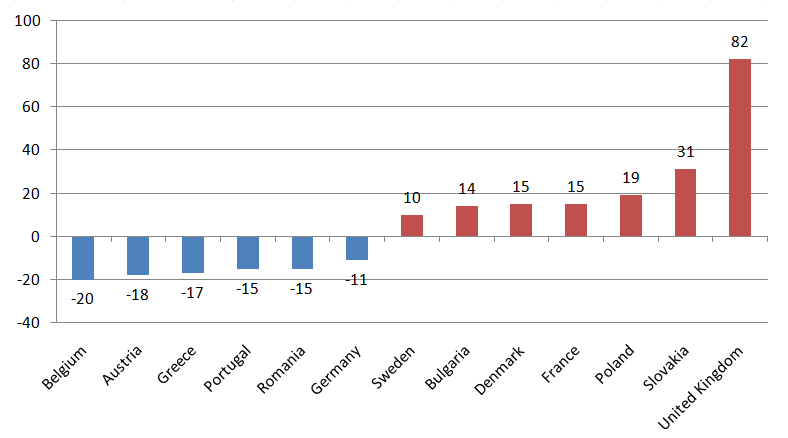
Source: Eurostat, IME calculations
In the countries where there are deepening differences between the poorest and richest region (shown in red, including Bulgaria), the reason is usually in the faster development of the wealthiest region, but we can still differentiate two groups:
- In Sweden, Denmark, France and the UK the wealth of poorest region has decreased, while GDP per capita in the richest one has increased;
- In Bulgaria, Poland and Slovakia the wealth of both the poorest, and the richest region has increased, but the difference has widened due to the faster development of the richest one.
An alternative look at the differences
In the same time, there are only four countries in the EU where the difference between the poorest and the richest region is greater than that in Bulgaria – the UK, Slovakia, the Czech Republic and Belgium. More than two times greater differences can be seen in Italy, Germany, Hungary, Poland and France. The smallest differences are observed in Croatia, Slovenia, Romania and Portugal.
Fig.3 Difference in GDP per capita (PPS) between the richest and the poorest region in EU countries
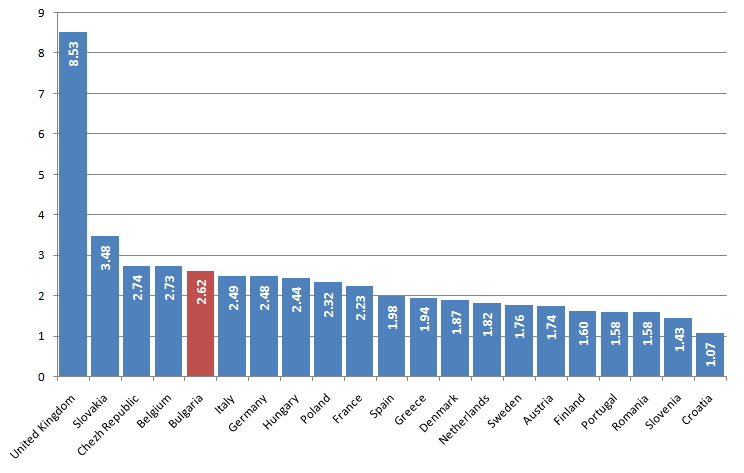
Source: Eurostat, IME calculations

