The Effects of Ethnicity, Age and Employment on Parliamentary Elections 2014
Yavor Aleksiev
After the previous parliamentary elections held in 2013 we examined the relationship between three major socio-economic factors (ethnicity, age, and occupation) and the results of the leading parties in the different districts of the country[1]. The results from the parliamentary elections held this month confirm some observations from last year – MRFMRF takes advantage of the “ethnicity” factor, BSP takes advantage of the “age” factor, CEDBCEDB takes advantage of the “employment” factor.
MRF takes advantage of the “ethnicity” factor
The distribution of votes in 2014 among districts has once again been significantly affected by the ethnic origin of the local population. In areas where the proportion of people who declare themselves Turks is over 30%, MRF won between 34.3% (Silistra) and 70.43% (Kardzhali) while nationwide, the party managed to win 14.84% of the votes. In areas with similar socio-economic profile such as Vidin and Kyustendil, in which the share of the Turkish population is smaller, the party gets respectively 6.64% and 1.47% of the votes.
Figure 1: Ethnicity and MRF election result
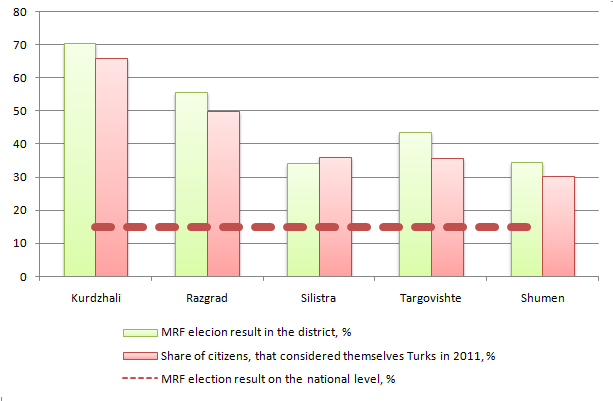
Source: Sources: CEC, NSI , IME calculations
The distribution of votes by district shows that MRF is the only of the 4 leading parties where there is a strong negative correlation between the share of the urban population and the election result. This means that the smaller the proportion of the urban population in one district is the higher is the MRF election result.
BSP takes advantage of the "age" factor
BSP is the only party which showed a positive correlation between the age structure of the population in most areas[2] and its tendency to vote for a given party. Its best results are achieved in districts[3] where the age dependency ratio of the population over 65 to that aged 15-64 is over 33%. This means that in these areas there are three or fewer people of working age for every person aged over 65 account for.
Figure 2: Age dependency and election result BSP
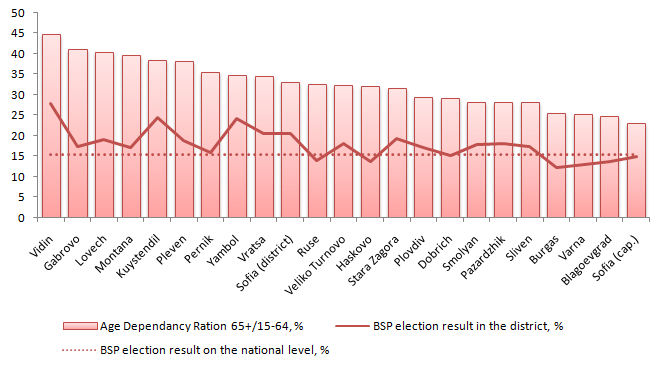
Source: NSI, CEC, IME calculations
BSP achieved its strongest result in Vidin, winning 27.93 percent of the vote. At the same time, although the relationship between the age of the population in different districts and its propensity to vote for BSP remains strong, the party failed to win in any of those nine areas. At the previous parliamentary elections, the party won in eight of them.
CEDBCEDB takes advantage of the “employment” factor
CEDB is the only party where electoral support exhibits a positive correlation with district employment rates.[4] This relationship is negativ only for BSP the results of RB and MRF show no distinctive connection with employment.
Figure 3: Employment and election result of CEDB
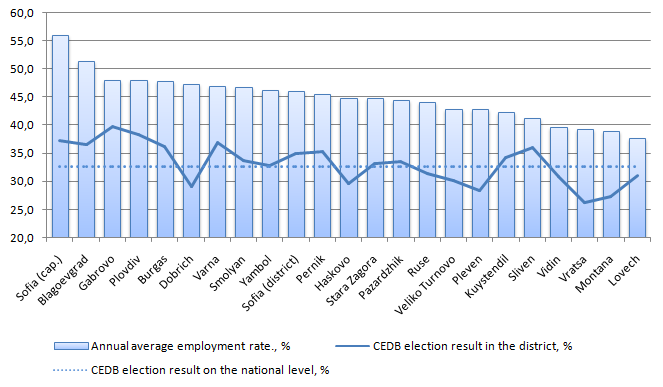
Source: NSI, CEC, IME calculations
CEDB’s results also show the most clearly expressed positive relationship between the share of urban population in different regions and the result of the party - in more urbanized areas CEDB wins a larger share of the vote.
The Reform bloc
The results of RB at the parliamentary elections in different districts revealed no clear relationship (positive or negative) between the votes received and the reviewed socio-economic indicators characterizing ethnicity, settlement, age structure and labor market situation.
[1] The figures represent a conditional comparison of viarious socio-economic indicators and election results in different administrative regions. These are under no circumstances to be considered as proof of the electoral moods of citizens based on their ethnic origin, age or socio-economic status; rather, these depict common tendencies in the shaping of political preferences of groups of people living in a different social, economic, political and cultural context.
[2] The five regions where MRF’s electoral dominance can be primarily attributed to the ethnicity factor have been excluded from the comparison between the age dependency ratio and the results of BSP.
[3] Vidin, Vratsa, Gabrovo, Kyustendil, Lovech, Montana, Pernik, Pleven and Yambol.
[4] The five regions where MRF’s electoral dominance can be primarily attributed to the ethnicity factor have been excluded from the comparison between the employment rate and CEDB’s results.

