Income: How Far Ahead is Sofia?
The economic crisis continues to deepen the differences between the capital and the rest of the country’s districts. This is true not only for indicators such as unemployment and employment, but also for the levels of average annual income. In this case, we take a look at the total earnings, which include monetary income (salary and other income, pensions, social benefits, income from sales and other transfers), as well as quantified natural income.
For the period from 2001 to 2011, the average annual growth rate of income in the capital is 12.36%, while the national average is 9.05%. In 19 out of the 28 districts, income is rising at a rate, lower than the national average. The only districts, which shows a higher growth rate of the income, compared to the capital, is Stara Zagora – 12.54% per year. Despite this, the average annual income in Stara Zagora remains � less than that in Sofia (capital) in 2011, because of the lower base in the beginning of the period.
Graph 1: Average annual growth rate of the total income per household member in the period 2001 – 2011, %
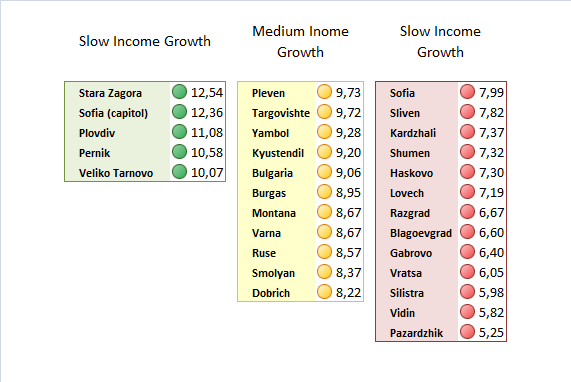
Source: NSI, IME’s calculations
Note: We have defined the growth rate as “fast” in districts, where the latter is higher by at least 1 percentage point the national average. The “medium” growth rate is lower or higher by less than 1 percentage point. A rate lower by more than 1 �percentage point means that the district falls into the category of those with “slowly” growing total income.
If the average annual growth rate, observed in the period 2001 – 2011, stays the same, it would be impossible to catch up to the capital[1]. Because of this, in order to illustrate the lag in the level of income in years, we assume that the income in the different districts will continue to rise with same average annual rate as in the period 2001 – 2011. Also, we assume that the real rise in income in the capital stops in 2012 and from this point on it rises only with the rate of inflation.[2]
Graph 2: When the rest of the country’s district will catch up to the capital
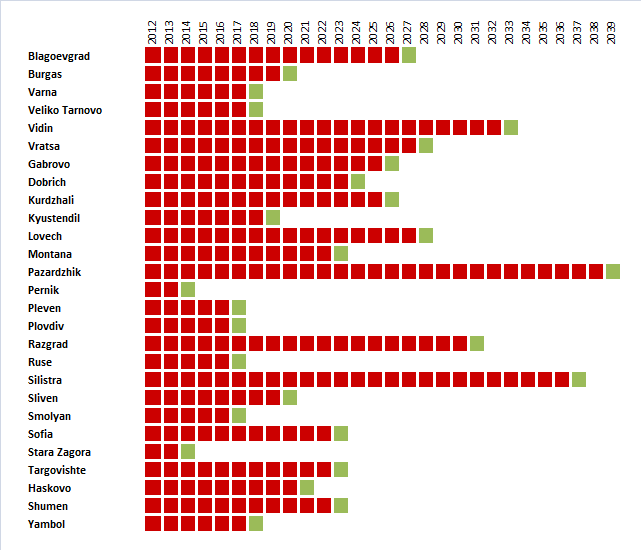
Source: NSI, IME’s calculations
If the income in the capital stopped rising in 2012 and income in the rest of the districts kept its rate of increase, the first ones to catch up to Sofia would be Stara Zagora and Pernik (in 2014). Several years later, the same would achieve Smolyan, Ruse, Pleven, and Plovdiv. The last ones to do so would be Vidin (in 2033), Silistra (in 2037), and Pazarzhik (2039).
This dynamic is, of course, conditional, but it gives a good idea of the time lag between the levels of total income in the capital and the rest of the country.
We should also note the different way, in which the crisis has affected the growth rate of income in the individual districts. For example, in recent years, in districts such as Stara Zagora and Sofia (district) the average annual growth rate of total income is higher than the one in the capital. Despite the development of this trend, significant changes in the overall dynamics in the long term seem unlikely.

