Development and Inequality at the Local Level
Petar Ganev
Despite being quite intriguing the data concerning poverty and inequality on the local level are often overlooked. It is widely known that every fifth Bulgarian lives below the poverty line, but regional differences are mostly ignored – for example in Vidin and Sliven this is the case for practically every third person. What’s more – every district has its own poverty line, which is formed by the median income in the district itself, in other words – this is the measure of the relative poverty levels in each separate district. The poverty line in Vidin is almost two times lower than the one in Sofia. Despite that the relative share of people below it is two times larger. Does this imply that the development of a given district leads to decreasing income inequality and vice-versa – does the lack of development lead to higher income inequality?
The poverty line in Bulgaria is a relative measure of poverty. Thus it is also a measure of inequality, since it is determined by the median income levels. Simply put – a poor person is someone whose income is lower than the income of others. Despite all the conditionality that the regional data on income and inequality levels suggest, the overview of the situation in Bulgarian districts gives a more or less affirmative answer to the questions above. Richer districts, where GDP per capita levels are higher, are usually the ones where fewer people live below the district’s relative poverty line. This also holds true for local inequality, measured by the ratio between the income of the richest and poorest 20% of households in those districts. This ratio varies from 3.5 in Blagoevgrad to over 10.0 in Vidin, Pazardzhik and Sliven.
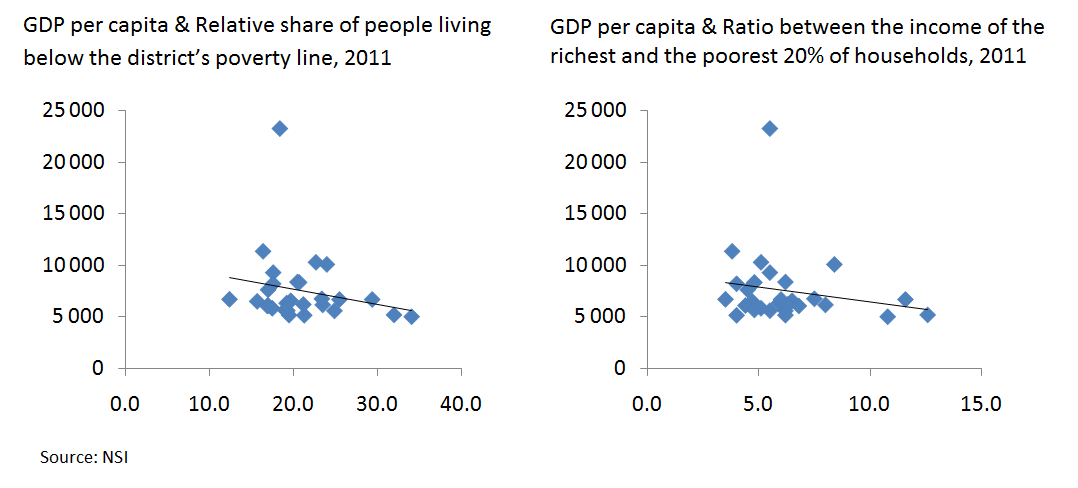
In both cases there are examples of poor districts, where income inequality is relatively low. However, there are hardly any examples of rich districts, where income inequality is high. For instance, Kardzhali and Lovech are poor districts, where income inequality is low. Stara Zagora is an example of a relatively rich district, where inequality is high. The overall view, however, doesn’t suggest a negative correlation between better economic development and rising inequality. These observations for the most part also hold true when we look at the Gini coefficient at the local level.
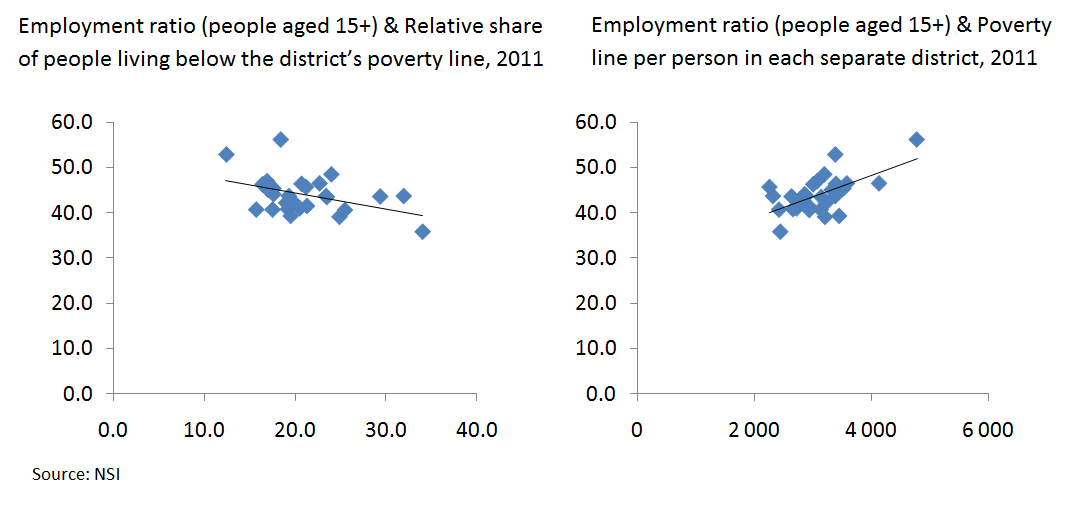
If we replace GDP per capita indicator with employment ratios, the correlation is even clearer. The assumption that higher employment leads to lower inequality is confirmed by the data. What’s even more interesting is that there is a strong correlation between the employment ratios and the poverty line itself – more jobs lead to higher median income levels, while also reducing the share of people living below that line. This is another argument that leads us to conclude that the focus of policies, targeted at reducing poverty should be on creating more jobs and not on income policies. The latter usually includes not only income redistribution, but also labor market interventions, which despite aiming to help the employed, actually drive the price of labor up and hinder job creation, especially in poorer districts.